

Download PDF - Ivie

Create successful ePaper yourself
Turn your PDF publications into a flip-book with our unique Google optimized e-Paper software.
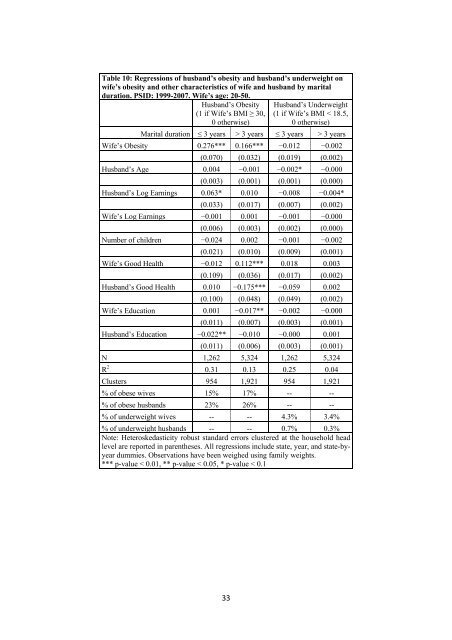
Table 10: Regressions of husband’s obesity and husband’s underweight on<br />
wife’s obesity and other characteristics of wife and husband by marital<br />
duration. PSID: 1999-2007. Wife’s age: 20-50.<br />
Husband’s Obesity<br />
(1 if Wife’s BMI ≥ 30,<br />
0 otherwise)<br />
Husband’s Underweight<br />
(1 if Wife’s BMI < 18.5,<br />
0 otherwise)<br />
Marital duration ≤ 3 years > 3 years ≤ 3 years > 3 years<br />
Wife’s Obesity 0.276*** 0.166*** −0.012 −0.002<br />
(0.070) (0.032) (0.019) (0.002)<br />
Husband’s Age 0.004 −0.001 −0.002* −0.000<br />
(0.003) (0.001) (0.001) (0.000)<br />
Husband’s Log Earnings 0.063* 0.010 −0.008 −0.004*<br />
(0.033) (0.017) (0.007) (0.002)<br />
Wife’s Log Earnings −0.001 0.001 −0.001 −0.000<br />
(0.006) (0.003) (0.002) (0.000)<br />
Number of children −0.024 0.002 −0.001 −0.002<br />
(0.021) (0.010) (0.009) (0.001)<br />
Wife’s Good Health −0.012 0.112*** 0.018 0.003<br />
(0.109) (0.036) (0.017) (0.002)<br />
Husband’s Good Health 0.010 −0.175*** −0.059 0.002<br />
(0.100) (0.048) (0.049) (0.002)<br />
Wife’s Education 0.001 −0.017** −0.002 −0.000<br />
(0.011) (0.007) (0.003) (0.001)<br />
Husband’s Education −0.022** −0.010 −0.000 0.001<br />
(0.011) (0.006) (0.003) (0.001)<br />
N 1,262 5,324 1,262 5,324<br />
R 2 0.31 0.13 0.25 0.04<br />
Clusters 954 1,921 954 1,921<br />
% of obese wives 15% 17% -- --<br />
% of obese husbands 23% 26% -- --<br />
% of underweight wives -- -- 4.3% 3.4%<br />
% of underweight husbands -- -- 0.7% 0.3%<br />
Note: Heteroskedasticity robust standard errors clustered at the household head<br />
level are reported in parentheses. All regressions include state, year, and state-byyear<br />
dummies. Observations have been weighed using family weights.<br />
*** p-value < 0.01, ** p-value < 0.05, * p-value < 0.1<br />
33


