Plani Kombėtar pėr Menaxhimin e Mbetjeve - Riciklimi.al
Plani Kombėtar pėr Menaxhimin e Mbetjeve - Riciklimi.al
Plani Kombėtar pėr Menaxhimin e Mbetjeve - Riciklimi.al

Create successful ePaper yourself
Turn your PDF publications into a flip-book with our unique Google optimized e-Paper software.
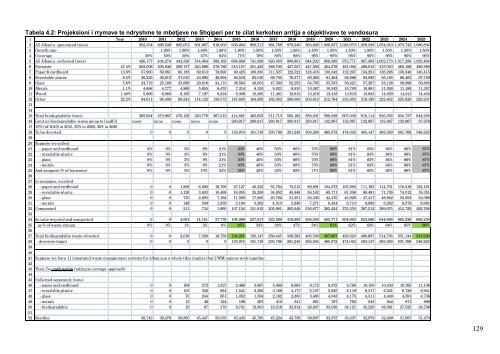
Tabela 4.2: Projeksioni i rrymave te ndryshme te mbetjeve ne Shqiperi per te cilat kerkohen arritja e objektivave te vendosura1 Year 2010 2011 2012 2013 2014 2015 2016 2017 2018 2019 2020 2021 2022 2023 2024 20252 All Albania - generated (tons) 852,354 868,549 885,051 901,867 919,003 936,464 950,511 964,768 979,240 993,928 1,008,837 1,023,970 1,039,329 1,054,919 1,070,743 1,086,8043 Growth rate 1.90% 1.90% 1.90% 1.90% 1.90% 1.50% 1.50% 1.50% 1.50% 1.50% 1.50% 1.50% 1.50% 1.50% 1.50%4 Coverage 50% 50% 50% 57% 64% 71% 78% 85% 92% 95% 95% 95% 95% 95% 95% 95%5 All Albania - collected (tons) 426,177 434,274 442,526 514,064 588,162 664,889 741,398 820,053 900,901 944,232 958,395 972,771 987,363 1,002,173 1,017,206 1,032,4646 Biowaste 47.4% 202,008 205,846 209,757 243,666 278,789 315,157 351,423 388,705 427,027 447,566 454,279 461,094 468,010 475,030 482,156 489,3887 Paper & cardboard 13.6% 57,960 59,061 60,183 69,913 79,990 90,425 100,830 111,527 122,522 128,416 130,342 132,297 134,281 136,296 138,340 140,4158 Recyclable plastic 8.5% 36,225 36,913 37,615 43,695 49,994 56,516 63,019 69,705 76,577 80,260 81,464 82,686 83,926 85,185 86,463 87,7599 Glass 5.8% 24,718 25,188 25,666 29,816 34,113 38,564 43,001 47,563 52,252 54,765 55,587 56,421 57,267 58,126 58,998 59,88310 Met<strong>al</strong>s 1.1% 4,688 4,777 4,868 5,655 6,470 7,314 8,155 9,021 9,910 10,387 10,542 10,700 10,861 11,024 11,189 11,35711 Wood 1.40% 5,966 6,080 6,195 7,197 8,234 9,308 10,380 11,481 12,613 13,219 13,418 13,619 13,823 14,030 14,241 14,45412 Other 22.2% 94,611 96,409 98,241 114,122 130,572 147,605 164,590 182,052 200,000 209,619 212,764 215,955 219,195 222,482 225,820 229,207131415 Tot<strong>al</strong> biodegradable (tons) 265,934 270,987 276,136 320,776 367,013 414,891 462,633 511,713 562,162 589,201 598,039 607,009 616,114 625,356 634,737 644,25816 Limit on biodegradable waste going to landfill none none none none none 280,917 280,917 280,917 280,917 280,917 132,967 132,967 132,967 132,967 132,967 97,97617 75% (of 2010) in 2015, 50% in 2020, 35% in 202518 To be diverted 0 0 0 0 0 133,974 181,716 230,796 281,245 308,284 465,072 474,042 483,147 492,389 501,769 546,2821920 Suppose we collect21 - paper and cardboard 0% 0% 3% 9% 21% 30% 40% 50% 60% 70% 80% 81% 83% 84% 86% 87%22 - recyclable plastic 0% 0% 3% 9% 21% 30% 40% 50% 60% 70% 80% 81% 83% 84% 86% 87%23 - glass 0% 0% 3% 9% 21% 30% 40% 50% 60% 70% 80% 81% 83% 84% 86% 87%24 - met<strong>al</strong>s 0% 0% 3% 9% 21% 30% 40% 50% 60% 70% 80% 81% 83% 84% 86% 87%25 And compost (% of biowaste) 0% 0% 3% 10% 24% 34% 43% 52% 62% 71% 80% 81% 83% 84% 86% 87%2627 In tonnages, recycled28 - paper and cardboard 0 0 1,806 6,292 16,798 27,127 40,332 55,764 73,513 89,891 104,273 107,690 111,185 114,761 118,419 122,16129 - recyclable plastic 0 0 1,128 3,933 10,499 16,955 25,208 34,852 45,946 56,182 65,171 67,306 69,491 71,726 74,012 76,35130 - glass 0 0 770 2,683 7,164 11,569 17,200 23,782 31,351 38,336 44,470 45,926 47,417 48,942 50,502 52,09831 - met<strong>al</strong>s 0 0 146 509 1,359 2,194 3,262 4,510 5,946 7,271 8,434 8,710 8,993 9,282 9,578 9,88132 Composted 0 0 211 734 1,960 107,154 151,815 203,681 263,049 316,877 363,424 375,330 387,512 399,975 412,725 425,7683334 So tot<strong>al</strong> recycled and composted 0 0 4,061 14,151 37,779 164,999 237,817 322,589 419,805 508,556 585,771 604,963 624,598 644,686 665,236 686,25835 as % of waste stream 0% 0% 1% 3% 6% 25% 32% 39% 47% 54% 61% 62% 63% 64% 65% 66%3637 Tot<strong>al</strong> biodegradable waste diverted 0 0 2,016 7,026 18,758 134,281 192,147 259,445 336,562 406,768 467,697 483,020 498,697 514,736 531,144 547,92938 diversion target 0 0 0 0 0 133,974 181,716 230,796 281,245 308,284 465,072 474,042 483,147 492,389 501,769 546,282394041 Suppose we have 11 integrated waste management systems for Albania as a whole (this implies that 2 WM regions work together.4243 Then, for each region (taking an average approach)4445 Collected separately (tons)46 - paper and cardboard 0 0 164 572 1,527 2,466 3,667 5,069 6,683 8,172 9,479 9,790 10,108 10,433 10,765 11,10647 - recyclable plastic 0 0 103 358 954 1,541 2,292 3,168 4,177 5,107 5,925 6,119 6,317 6,521 6,728 6,94148 - glass 0 0 70 244 651 1,052 1,564 2,162 2,850 3,485 4,043 4,175 4,311 4,449 4,591 4,73649 - met<strong>al</strong>s 0 0 13 46 124 199 297 410 541 661 767 792 818 844 871 89850 - biodegradable 0 0 19 67 178 9,741 13,801 18,516 23,914 28,807 33,039 34,121 35,228 36,361 37,520 38,7065152 Residue 38,743 39,479 39,860 45,447 50,035 45,445 45,780 45,224 43,736 39,607 33,875 33,437 32,979 32,499 31,997 31,473129