4 - Fakulta medzinárodných vzťahov - Ekonomická univerzita v ...
4 - Fakulta medzinárodných vzťahov - Ekonomická univerzita v ... 4 - Fakulta medzinárodných vzťahov - Ekonomická univerzita v ...
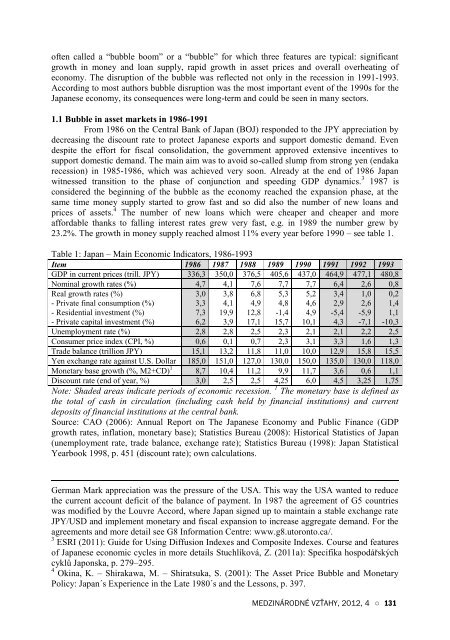
often called a “bubble boom” or a “bubble” for which three features are typical: significantgrowth in money and loan supply, rapid growth in asset prices and overall overheating ofeconomy. The disruption of the bubble was reflected not only in the recession in 1991-1993.According to most authors bubble disruption was the most important event of the 1990s for theJapanese economy, its consequences were long-term and could be seen in many sectors.1.1 Bubble in asset markets in 1986-1991From 1986 on the Central Bank of Japan (BOJ) responded to the JPY appreciation bydecreasing the discount rate to protect Japanese exports and support domestic demand. Evendespite the effort for fiscal consolidation, the government approved extensive incentives tosupport domestic demand. The main aim was to avoid so-called slump from strong yen (endakarecession) in 1985-1986, which was achieved very soon. Already at the end of 1986 Japanwitnessed transition to the phase of conjunction and speeding GDP dynamics. 3 1987 isconsidered the beginning of the bubble as the economy reached the expansion phase, at thesame time money supply started to grow fast and so did also the number of new loans andprices of assets. 4 The number of new loans which were cheaper and cheaper and moreaffordable thanks to falling interest rates grew very fast, e.g. in 1989 the number grew by23.2%. The growth in money supply reached almost 11% every year before 1990 – see table 1.Table 1: Japan – Main Economic Indicators, 1986-1993Item 1986 1987 1988 1989 1990 1991 1992 1993GDP in current prices (trill. JPY) 336,3 350,0 376,5 405,6 437,0 464,9 477,1 480,8Nominal growth rates (%) 4,7 4,1 7,6 7,7 7,7 6,4 2,6 0,8Real growth rates (%) 3,0 3,8 6,8 5,3 5,2 3,4 1,0 0,2- Private final consumption (%) 3,3 4,1 4,9 4,8 4,6 2,9 2,6 1,4- Residential investment (%) 7,3 19,9 12,8 -1,4 4,9 -5,4 -5,9 1,1- Private capital investment (%) 6,2 3,9 17,1 15,7 10,1 4,3 -7,1 -10,3Unemployment rate (%) 2,8 2,8 2,5 2,3 2,1 2,1 2,2 2,5Consumer price index (CPI, %) 0,6 0,1 0,7 2,3 3,1 3,3 1,6 1,3Trade balance (trillion JPY) 15,1 13,2 11,8 11,0 10,0 12,9 15,8 15,5Yen exchange rate against U.S. Dollar 185,0 151,0 127,0 130,0 150,0 135,0 130,0 118,0Monetary base growth (%, M2+CD) 1 8,7 10,4 11,2 9,9 11,7 3,6 0,6 1,1Discount rate (end of year, %) 3,0 2,5 2,5 4,25 6,0 4,5 3,25 1,75Note: Shaded areas indicate periods of economic recession. 1 The monetary base is defined asthe total of cash in circulation (including cash held by financial institutions) and currentdeposits of financial institutions at the central bank.Source: CAO (2006): Annual Report on The Japanese Economy and Public Finance (GDPgrowth rates, inflation, monetary base); Statistics Bureau (2008): Historical Statistics of Japan(unemployment rate, trade balance, exchange rate); Statistics Bureau (1998): Japan StatisticalYearbook 1998, p. 451 (discount rate); own calculations.German Mark appreciation was the pressure of the USA. This way the USA wanted to reducethe current account deficit of the balance of payment. In 1987 the agreement of G5 countrieswas modified by the Louvre Accord, where Japan signed up to maintain a stable exchange rateJPY/USD and implement monetary and fiscal expansion to increase aggregate demand. For theagreements and more detail see G8 Information Centre: www.g8.utoronto.ca/.3 ESRI (2011): Guide for Using Diffusion Indexes and Composite Indexes. Course and featuresof Japanese economic cycles in more details Stuchlíková, Z. (2011a): Specifika hospodářskýchcyklů Japonska, p. 279–295.4 Okina, K. – Shirakawa, M. – Shiratsuka, S. (2001): The Asset Price Bubble and MonetaryPolicy: Japan´s Experience in the Late 1980´s and the Lessons, p. 397.MEDZINÁRODNÉ VZŤAHY, 2012, 4 ○ 131
The consequence was a strong growth in consumers´ spending of households andinvestments into properties and securities leading to rapid growth in their prices (so-called assetinflation) – see figure 1. The overall price level (measured by CPI index) remained stable,mainly thanks to decreasing prices of imports (together with strengthening JPY exchange rate). 5The main stock exchange index Nikkei 225 Average reached the top with JPY 38.916at the end of 1985, i.e. it increased by almost three times compared to its level in 1985. Besidesthe growing value of securities, the tradinge volume at Tokyo and other Japanese stockexchanges was also growing. In the same period the land price index grew almost four times.Land prices (especially in biggest cities) had grown relatively fast even already before 1986,when the BOJ reduced the interest rates. Asset prices started to accelerate already around 1982. 6Figure 1: Nikkei 225 Average and Trading Volume at Tokyo Stock Exchange, 1985-2002JPYVolume in ten-thousands of shares400004000035000Nikei 225 AverageTrading volume35000300003000025000250002000020000150001500010000100001985 1986 1987 1988 1989 1990 1991 1992 1993 1994 1995 1996 1997 1998 1999 2000 2001 2002Note: The Nikkei 225 Average is comprised of the 225 highly liquid stocks of the Tokyo StockExchange 1st Section at the end of month (left scale). Trading volume at the Tokyo StockExchange 1se Section, monthly average amount of traded stocks in one day (right scale).Source: Statistics Bureau (2008): Historical Statistics of Japan; BOJ (2002): Stock MarketStatistics; own construction.Approximately in the same period there were bubbles also in other developed OECDcountries, e.g. Great Britain, Finland and Sweden. Even though a comparison is difficult, thelevel of asset price fluctuations in Japan was the biggest, as well as the level of bad assets heldby financial institutions after the bubble disruption and value of public means invested intosettling of bad loans. According to the OECD this has been the biggest bubble in OECDcountries after World War II (before asset price bubbles in 2008-2009). 7From the Japanese view it was the biggest and longest bubble after the war. Duringthis bubble the economy grew at a similar pace as in the period of fast growth in the 1960s.However, the second longest expansion was followed by the second longest recession after thebubble disruption. Average pace of the real GDP growth in 1986-1991 was 4.4%, the average indeveloped countries reached 3.3% according to the UNCTAD (in the USA only 2.9%). 8 Thegrowth was driven by private capital investments and private consumption and mainly by5 Factors of buble rise of a bubble in the asset market, see Stuchlíková, Z. (2011b): Japonskábublina na trzích aktiv a důsledky jejího prasknutí počátkem 90. let 20. století, p. 91–107.Development of the Japanese economy until the rise of the bubble, compare Stuchlíková, Z.(2011c): Japonský hospodářský zázrak. To the development of the Japanese economy from theend of the 1970s to the end of 1980s see p. 43–69.6 Statistics Bureau (2008): Historical Statistics of Japan.7 OECD (1998): Economic Survey – Japan, 1998, p. 45.8 UNCTAD (1997): Handbook of International Trade and Development 1996/97, p. 324, 325.132 ○ MEDZINÁRODNÉ VZŤAHY, 2012, 4
- Page 82 and 83: nachádzali v Pakistane, kde v úlo
- Page 84 and 85: jedna skupina argumentuje množstvo
- Page 86 and 87: 28. OLCOTT, M. BRILL (2012). Centra
- Page 88 and 89: planéty Zem, je možné identifiko
- Page 90 and 91: vysokohorských ľadovcov a snehove
- Page 92 and 93: populácie človeka. Len v roku 200
- Page 94 and 95: s tým sú „tiché“ krízy spô
- Page 96 and 97: druhov rastlín alebo globálne ote
- Page 98 and 99: 10. MACGRANAHAN, G., BALK, D. , et
- Page 100 and 101: D I S K U S I ASÚČASNÉ A OČAKÁ
- Page 102 and 103: v Afrike, keďže Maurícius nedisp
- Page 104 and 105: v Baoaré. Krajina patrí medzi naj
- Page 106 and 107: nadmerné znečistenie vody v Čín
- Page 108 and 109: ZÁVERPredkladaný článok analyzu
- Page 110 and 111: D I S K U S I AŠPECIFIKÁ POSTAVEN
- Page 112 and 113: stálym obyvateľstvom, definovaný
- Page 114 and 115: občianstve, ktoré zakladajú prim
- Page 116 and 117: Špecifické a nezameniteľné post
- Page 118 and 119: dochádza v prípadoch exilových v
- Page 120 and 121: P R E H Ľ A DPROBLEM OF EASTERN PA
- Page 122 and 123: countries where the development of
- Page 124 and 125: In the Joint Declaration it was sta
- Page 126 and 127: On the partners’ side we see that
- Page 128 and 129: espect for ordinary citizens of the
- Page 130 and 131: P R E H Ľ A DJAPAN´S LOST DECADE:
- Page 134 and 135: investments into properties - see t
- Page 136 and 137: Ongoing appreciation of the currenc
- Page 138 and 139: usinesses etc.) as well as by long-
- Page 140 and 141: eject it), but he favours the monet
- Page 142 and 143: was bound to take steps. Many other
- Page 144 and 145: preferences. Massive fiscal incetiv
- Page 146 and 147: end of 1998. 55 The crisis also dee
- Page 148 and 149: The central bank also responded to
- Page 150 and 151: 4. CALLEN, T. - McKIBBIN, W. J. (20
- Page 152 and 153: 1, February 2001. [20.3.2008.] Avai
- Page 154 and 155: P R E H Ľ A DINŠTITUCIONÁLNE MOD
- Page 156 and 157: zahraničného obchodu s Nemeckom (
- Page 158 and 159: diplomacie v podmienkach, keď real
- Page 160 and 161: organizačnej matice sú: ministers
- Page 162 and 163: neprítomnosti ďalších pilierov
- Page 164 and 165: oddelenia, sú v rámci veľvyslane
- Page 166 and 167: ktorý aplikuje Nemecko. V tomto mo
- Page 168 and 169: ZÁVERModely organizácie hospodár
- Page 170 and 171: 20. TÓTH, Ľ. - HORVÁTHOVÁ, K. (
- Page 172 and 173: podmienky. Od sedemdesiatych rokov
- Page 174 and 175: 1 Tradičné teórie medzinárodný
- Page 176 and 177: okolitých štátov. Násilné pres
- Page 178 and 179: 1.3 NeorealizmusRealistický smer s
- Page 180 and 181: a morálnosti. Teroristické a extr
often called a “bubble boom” or a “bubble” for which three features are typical: significantgrowth in money and loan supply, rapid growth in asset prices and overall overheating ofeconomy. The disruption of the bubble was reflected not only in the recession in 1991-1993.According to most authors bubble disruption was the most important event of the 1990s for theJapanese economy, its consequences were long-term and could be seen in many sectors.1.1 Bubble in asset markets in 1986-1991From 1986 on the Central Bank of Japan (BOJ) responded to the JPY appreciation bydecreasing the discount rate to protect Japanese exports and support domestic demand. Evendespite the effort for fiscal consolidation, the government approved extensive incentives tosupport domestic demand. The main aim was to avoid so-called slump from strong yen (endakarecession) in 1985-1986, which was achieved very soon. Already at the end of 1986 Japanwitnessed transition to the phase of conjunction and speeding GDP dynamics. 3 1987 isconsidered the beginning of the bubble as the economy reached the expansion phase, at thesame time money supply started to grow fast and so did also the number of new loans andprices of assets. 4 The number of new loans which were cheaper and cheaper and moreaffordable thanks to falling interest rates grew very fast, e.g. in 1989 the number grew by23.2%. The growth in money supply reached almost 11% every year before 1990 – see table 1.Table 1: Japan – Main Economic Indicators, 1986-1993Item 1986 1987 1988 1989 1990 1991 1992 1993GDP in current prices (trill. JPY) 336,3 350,0 376,5 405,6 437,0 464,9 477,1 480,8Nominal growth rates (%) 4,7 4,1 7,6 7,7 7,7 6,4 2,6 0,8Real growth rates (%) 3,0 3,8 6,8 5,3 5,2 3,4 1,0 0,2- Private final consumption (%) 3,3 4,1 4,9 4,8 4,6 2,9 2,6 1,4- Residential investment (%) 7,3 19,9 12,8 -1,4 4,9 -5,4 -5,9 1,1- Private capital investment (%) 6,2 3,9 17,1 15,7 10,1 4,3 -7,1 -10,3Unemployment rate (%) 2,8 2,8 2,5 2,3 2,1 2,1 2,2 2,5Consumer price index (CPI, %) 0,6 0,1 0,7 2,3 3,1 3,3 1,6 1,3Trade balance (trillion JPY) 15,1 13,2 11,8 11,0 10,0 12,9 15,8 15,5Yen exchange rate against U.S. Dollar 185,0 151,0 127,0 130,0 150,0 135,0 130,0 118,0Monetary base growth (%, M2+CD) 1 8,7 10,4 11,2 9,9 11,7 3,6 0,6 1,1Discount rate (end of year, %) 3,0 2,5 2,5 4,25 6,0 4,5 3,25 1,75Note: Shaded areas indicate periods of economic recession. 1 The monetary base is defined asthe total of cash in circulation (including cash held by financial institutions) and currentdeposits of financial institutions at the central bank.Source: CAO (2006): Annual Report on The Japanese Economy and Public Finance (GDPgrowth rates, inflation, monetary base); Statistics Bureau (2008): Historical Statistics of Japan(unemployment rate, trade balance, exchange rate); Statistics Bureau (1998): Japan StatisticalYearbook 1998, p. 451 (discount rate); own calculations.German Mark appreciation was the pressure of the USA. This way the USA wanted to reducethe current account deficit of the balance of payment. In 1987 the agreement of G5 countrieswas modified by the Louvre Accord, where Japan signed up to maintain a stable exchange rateJPY/USD and implement monetary and fiscal expansion to increase aggregate demand. For theagreements and more detail see G8 Information Centre: www.g8.utoronto.ca/.3 ESRI (2011): Guide for Using Diffusion Indexes and Composite Indexes. Course and featuresof Japanese economic cycles in more details Stuchlíková, Z. (2011a): Specifika hospodářskýchcyklů Japonska, p. 279–295.4 Okina, K. – Shirakawa, M. – Shiratsuka, S. (2001): The Asset Price Bubble and MonetaryPolicy: Japan´s Experience in the Late 1980´s and the Lessons, p. 397.MEDZINÁRODNÉ VZŤAHY, 2012, 4 ○ 131


