slovenija A5.pmd - StatistiÄni urad Republike Slovenije
slovenija A5.pmd - StatistiÄni urad Republike Slovenije
slovenija A5.pmd - StatistiÄni urad Republike Slovenije

Create successful ePaper yourself
Turn your PDF publications into a flip-book with our unique Google optimized e-Paper software.
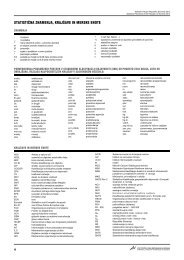
Statistical Portrait of Slovenia in the EU<br />
Italija<br />
Italy<br />
Latvija<br />
Latvia<br />
Litva<br />
Lithua-<br />
nia<br />
Luksem-<br />
Nizo-<br />
Združeno<br />
burg<br />
Madžar-<br />
Malta Nemèija zemska Poljska<br />
Portu-<br />
Slovaška Španija Švedska kraljestvo<br />
Luxemska<br />
Malta Germany Nether- Poland<br />
galska<br />
Slovakia Spain Sweden United<br />
bourg<br />
Hungary<br />
lands Portugal<br />
Kingdom<br />
Population<br />
1,0 4) -0,5 -0,5 3) 0,7 -0,3 3) 0,7 0,0 4) 0,4 3) -0,1 0,60,0 1,9 3) 0,4 0,5 4) Annual population growth rate (%)<br />
14,4 1) 16,0 18,3 18,8 16,1 19,2 2) 15,0 18,617,8 15,8 18,0 14,6 2) 18,0 18,9 1) Population aged 0-14 in % of total population<br />
18,2 1) 15,9 14,7 14,0 15,4 12,6 2) 17,5 13,7 12,8 16,7 11,6 17,1 2) 17,2 15,6 1) Population aged 65 and over in % of total<br />
population<br />
Life expectancy at birth (years)<br />
76,9 4) 65,5 3) 66,3 3) 74,9 2) 68,4 2) 75,9 2) 75,5 4) 76,1 3) 70,5 74,0 4) 69,9 2) 77,2 4) 77,9 76,2 4) men<br />
82,9 4) 76,8 3) 77,7 3) 81,5 2) 76,7 2) 81,0 2) 81,3 4) 80,8 3) 78,9 80,5 4) 77,8 2) 83,7 4) 82,4 80,7 4) women<br />
9,5 4) 9,0 8,9 3) 11,8 9,3 3) 10,0 8,7 4) 12,4 3) 9,2 10,8 9,610,4 4) 11,1 11,7 4) Live births per 1 000 population<br />
10,8 2)4) 44,2 29,5 25,0 32,3 16,8 26,2 3) 31,3 3) 15,9 27,0 23,3 23,2 4) 56,0 43,1 3) Live births outside marriage (%)<br />
1,29 4) 1,29 3) 1,25 3) 1,63 1,30 3) 1,41 4) 1,34 4) 1,75 3) 1,24 4) 1,44 4) 1,17 4) 1,29 4) 1,71 1,71 4) Average number of children per woman<br />
... 24,9 24,3 28,8 25,6... 28,4 1) 28,7 25,0 26,8 24,7 29,1 5) 28,3 29,1 5) Mean age of woman at birth of first child<br />
9,9 4) 13,9 11,9 3) 9,1 13,4 3) 8,0 10,4 4) 8,7 3) 9,610,4 9,7 9,1 4) 10,4 10,3 4) Deaths per 1 000 population<br />
4,3 4) 9,4 6,7 4,9 7,3 5,9 4,2 3) 4,8 3) 7,0 4,0 7,9 3,2 4) 2,8 5,3 3) Infant mortality per 1 000 live births<br />
... 47,9 81,7 28,0 43,7 ... ... 12,625,7 1) 17,1 22,7 1) 11,0 1) 17,4 1) ... Death by suicide: men per 100 000 men<br />
... 10,1 11,5 9,8 10,1 ... ... 5,7 4,6 1) 4,2 3,9 1) 3,1 1) 7,2 1) ... Death by suicide: women per 100 000 women<br />
4,5 4) 4,3 4,9 3) 4,4 4,5 3) 5,9 4,6 4) 5,0 3) 5,1 5,1 4,8 4,9 4) 4,4 ... Marriages per 1 000 population<br />
0,7 2)4) 2,1 3,1 3) 2,3 2,5 3) ... 2,5 2) 2,0 3) 1,3 2,1 2,0 1,0 2)3) 2,4 2,7 2)4) Divorces per 1 000 population<br />
... 24,8 24,1 27,7 25,5 ... 27,2 1) 28,2 24,4 25,9 24,6... 30,1 ... Mean age of woman at first marriage<br />
... 26,7 26,3 30,1 28,2 ... 29,8 1) 30,7 26,7 27,7 27,3 ... 32,5 ... Mean age of man at first marriage<br />
7