slovenija A5.pmd - StatistiÄni urad Republike Slovenije
slovenija A5.pmd - StatistiÄni urad Republike Slovenije
slovenija A5.pmd - StatistiÄni urad Republike Slovenije

You also want an ePaper? Increase the reach of your titles
YUMPU automatically turns print PDFs into web optimized ePapers that Google loves.
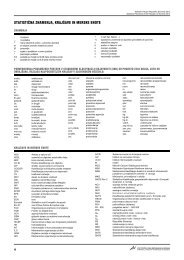
Statistical Portrait of Slovenia in the EU<br />
Italija<br />
Italy<br />
Latvija<br />
Latvia<br />
Litva<br />
Lithua-<br />
nia<br />
Luksem-<br />
Nizo-<br />
Združeno<br />
burg<br />
Madžar-<br />
Malta Nemèija zemska Poljska<br />
Portu-<br />
Slovaška Španija Švedska kraljestvo<br />
Luxemska<br />
Malta Germany Nether- Poland<br />
galska<br />
Slovakia Spain Sweden United<br />
bourg<br />
Hungary<br />
lands Portugal<br />
Kingdom<br />
Agriculture<br />
22,7 44,4 30,634,3 19,0 ... 29,5 8,5 28,9 37,7 ... 32,6 ... ... Wooded area as % of total area<br />
51,8 38,5 53,4 49,5 63,0 30,7 47,7 46,5 58,8 41,3 ... 50,2 6,6 68,0 Utilised agricultural area as % of total area<br />
1 964 127 272 2 773 11 472 1) 86... 416 1) 72 1 287 1) 68 281 Number of agricultural holdings (1 000)<br />
30 4646 19 24 13 9 1) 7 ... 23 1) 18 27 1) 12 16Female holders as % of total holders on<br />
family farms<br />
44,9 0,61,3 0,3 5,9 0,1 43,1 19,5 12,9 6,3 1,8 42,0 4,624,2 Agricurtural output at basic prices (mio EUR)<br />
of which:<br />
65,2 51,6 60,4 35,5 56,2 37,8 51,1 51,0 49,1 64,0 56,2 63,3 46,1 39,6 % crop output<br />
31,7 47,3 38,9 61,6 38,1 62,2 45,6 39,4 48,3 35,9 40,4 35,651,3 56,1 % animal output<br />
3,1 1,1 0,7 2,9 5,7 - 3,3 9,62,60,1 3,5 1,1 2,6 4,4 % agricurtural services output<br />
6 727 379 812 185 739 18 13 386 3 735 5 277 1 389 593 6 548 1 553 10 519 Cattle (1 000 heads)<br />
1 913 186448 41 310 8 4 338 1 551 2 816 328 214 1 118 404 2 207 Dairy cows (1 000 heads)<br />
9 157 444 1 057 76 4 913 73 26 495 10 766 18 439 2 249 1 443 24 056 2 004 4 842 Pigs (1 000 heads)<br />
3,7 3,0 4,0 6,8 5,1 ... 8,2 9,0 4,3 1,0 4,9 3,3 6,0 7,9 Production of wheat per hectare (t)<br />
33,3 2) 37,0 2) 39,5 ... 41,3 ... 53,2 2) 59,9 41,0 58,3 41,4 67,7 49,6 2) 55,0 Production of sugarbeet per hectare (t)<br />
21,8 2) 14,7 16,1 35,0 18,6 2) 22,9 43,1 44,3 19,3 15,2 16,7 27,7 30,9 41,5 Production of potatoes per hectare (t)<br />
21