slovenija A5.pmd - StatistiÄni urad Republike Slovenije
slovenija A5.pmd - StatistiÄni urad Republike Slovenije
slovenija A5.pmd - StatistiÄni urad Republike Slovenije

You also want an ePaper? Increase the reach of your titles
YUMPU automatically turns print PDFs into web optimized ePapers that Google loves.
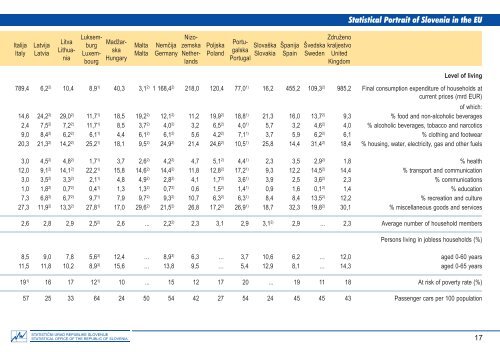
Statistical Portrait of Slovenia in the EU<br />
Italija<br />
Italy<br />
Latvija<br />
Latvia<br />
Litva<br />
Lithua-<br />
nia<br />
Luksem-<br />
Nizo-<br />
Združeno<br />
burg<br />
Madžar-<br />
Malta Nemèija zemska Poljska<br />
Portu-<br />
Slovaška Španija Švedska kraljestvo<br />
Luxemska<br />
Malta Germany Nether- Poland<br />
galska<br />
Slovakia Spain Sweden United<br />
bourg<br />
Hungary<br />
lands Portugal<br />
Kingdom<br />
Level of living<br />
789,4 6,2 2) 10,4 8,9 1) 40,3 3,1 2) 1 168,4 2) 218,0 120,4 77,0 1) 16,2 455,2 109,3 2) 985,2 Final consumption expenditure of households at<br />
current prices (mrd EUR)<br />
of which:<br />
14,624,2 2) 29,0 2) 11,7 1) 18,5 19,2 2) 12,1 2) 11,2 19,9 2) 18,8 1) 21,3 16,0 13,7 2) 9,3 % food and non-alcoholic beverages<br />
2,4 7,5 2) 7,2 2) 11,7 1) 8,5 3,7 2) 4,0 2) 3,2 6,5 2) 4,0 1) 5,7 3,2 4,6 2) 4,0 % alcoholic beverages, tobacco and narcotics<br />
9,0 8,4 2) 6,2 2) 6,1 1) 4,4 6,1 2) 6,1 2) 5,64,2 2) 7,1 1) 3,7 5,9 6,2 2) 6,1 % clothing and footwear<br />
20,3 21,3 2) 14,2 2) 25,2 1) 18,1 9,5 2) 24,9 2) 21,4 24,6 2) 10,5 1) 25,8 14,4 31,4 2) 18,4 % housing, water, electricity, gas and other fuels<br />
3,0 4,5 2) 4,8 2) 1,7 1) 3,7 2,6 2) 4,2 2) 4,7 5,1 2) 4,4 1) 2,3 3,5 2,9 2) 1,8 % health<br />
12,0 9,1 2) 14,1 2) 22,2 1) 15,8 14,6 2) 14,4 2) 11,8 12,8 2) 17,2 1) 9,3 12,2 14,5 2) 14,4 % transport and communication<br />
3,0 3,5 2) 3,3 2) 2,1 1) 4,8 4,9 2) 2,8 2) 4,1 1,7 2) 3,6 1) 3,9 2,5 3,6 2) 2,3 % communications<br />
1,0 1,8 2) 0,7 2) 0,4 1) 1,3 1,3 2) 0,7 2) 0,61,5 2) 1,4 1) 0,9 1,60,1 2) 1,4 % education<br />
7,3 6,8 2) 6,7 2) 9,7 1) 7,9 9,7 2) 9,3 2) 10,7 6,3 2) 6,3 1) 8,4 8,4 13,5 2) 12,2 % recreation and culture<br />
27,3 11,9 2) 13,3 2) 27,8 1) 17,0 29,6 2) 21,5 2) 26,8 17,2 2) 26,9 1) 18,7 32,3 19,8 2) 30,1 % miscellaneous goods and services<br />
2,62,8 2,9 2,5 2) 2,6... 2,2 2) 2,3 3,1 2,9 3,1 2) 2,9 ... 2,3 Average number of household members<br />
Persons living in jobless households (%)<br />
8,5 9,0 7,8 5,6 3) 12,4 … 8,9 3) 6,3 … 3,7 10,6 6,2 … 12,0 aged 0-60 years<br />
11,5 11,8 10,2 8,9 3) 15,6… 13,8 9,5 … 5,4 12,9 8,1 … 14,3 aged 0-65 years<br />
19 1) 1617 12 1) 10 ... 15 12 17 20 ... 19 11 18 At risk of poverty rate (%)<br />
57 25 33 64 24 50 54 42 27 54 24 45 45 43 Passenger cars per 100 population<br />
17