GJ - Privredna komora Srbije
GJ - Privredna komora Srbije GJ - Privredna komora Srbije
Figure 1: Ground plan of set up monitoring system [6] Observations were performed in different time: • minutely readings ( every 10 and 30 min), • hourly readings (every 1, 3, 6 and 12 hours) and • daily readings (every 24 hours). The accuracy of the performed observations depended upon incidence, the used time interval of readings and reception of satellite signals. Maximum accuracy of observations is achieved when using a 24-hour interval. PROCESSING OF OBSERVATION READINGS Before accuracy comparison could take place the data gathered in hourly and daily GNSS observations had to be properly processed. The most accurate are the observations made at 24-hour intervals and are therefore used as the control segment for observations made in smaller time intervals. The observations done in hourly intervals had to be adjusted and the input data necessary for accuracy comparison had to be eliminated from observations made in both time intervals. Observations made in hourly intervals in ideal conditions gave 24 readings per day, respectively 24 records of coordinate triplets Y, X , H . When daily observations were used only one triplet of coordinates Y, X , H was obtained for one day. After the adjustment by parameter variation was made on hourly observations the most probable value of the coordinate triplets was obtained. At the same time the reduction of made observations was also carried out thus obtaining one most probable triplet instead of 24 triplets per day. 309
HOURLY MEASUREMENTS DAILY MEASUREMENTS 24 measurements per day (in ideal conditions) 1 measurement per day Adjustment by parameter variation One triplet (Y, X, H) for individual day One triplet (Y, X, H) for individual day Accuracy comparison between hourly and daily observations Figure 17: Processing of input data Two different adjustments by parameter variation procedures were performed depending on the input data. In both cases of the adjustment procedure a priori variance of unit weight was used. The first adjustment by parameter variation procedure is based solely on the assessment of the a priori variance of the unit weight whilst the second procedure also takes into account the cofactor matrix of prior measurements. With the help of adjustment by parameter variation [1]: • The procedure with which precise values of multiple measurements are determined is derived as well as the most definite values based on mutual mathematical correlation, • The evaluation of accuracy and reliability of measured and adjusted data is made. The procedure of adjustment by parameter variation is based on the on the method of least squares. The method of least squares means minimizing the sum of squared residuals of measured quantities defined by: vv min pvv ali min (1) or in matrix terms T T T v v min ali v Pv v Q v min (2) -1 ll In order to assure better transparency and understanding of the two adjustments procedures were labelled SAS 2 for the first method and SAS 3 for the second method. Observations had different accuracies so the weighted arithmetic mean was applied in both cases. Adjustment of hourly measurements The procedures used for the adjustment of hourly observations differed upon the input data. In the first variance procedure ( SAS 2 ) the a priory variance of unit weight was used as an input data whilst the second 310
- Page 260 and 261: Slika 9: Poprečni presek prilaznog
- Page 262 and 263: LITERATURA 1. Rudarski projekt za i
- Page 264 and 265: N slika1. Pregledna geografska kart
- Page 266 and 267: 4.0. TEHNOLOGIJA OTKOPAVANJA OTKRIV
- Page 268 and 269: Odlaganje kvartarnih glina Tabela b
- Page 270 and 271: TEHNIĈKE KARAKTERISTIKE ODLAGAĈA
- Page 272 and 273: Kamenolom ''Nepri~ava'' (kre~njak)
- Page 274 and 275: ALUGA 114.0 1 0 98.8 1 0 693 2 730
- Page 276 and 277: c) Izdan u peskovima gornjeg ponta.
- Page 278 and 279: REKA KOLUBARA F AZA P.S 107.5 105 9
- Page 280 and 281: KORELACONE VEZE MEĐU POJAVAMA KOLI
- Page 282 and 283: 2,100 1,900 1,700 1,500 1,300 rasip
- Page 284 and 285: Za 1,095 (kolona 8): (1,095 - 1,447
- Page 286 and 287: X Y X 2 Y 2 x x y y 2 x x y
- Page 288 and 289: 10. Zakljuĉak Na osnovu ispitivanj
- Page 290 and 291: flore i faune na mestu odlaganja, b
- Page 292 and 293: Slika 1. Geomorfološka mapa kostol
- Page 294 and 295: Klaster 1 (n=3) Klaster 2 (n=6) Kla
- Page 296 and 297: najkvalitetnijih sojeva za komercij
- Page 298 and 299: FITOREMEDIJACIJA TEŠKIH METALA IZ
- Page 300 and 301: Današnja tehnologija osnivanja zas
- Page 302 and 303: POLJOPRIVREDNA PROIZVODNJA NA DEPOS
- Page 304 and 305: Slika 2. Prirodno zemljište je pot
- Page 306 and 307: hemijskih analiza treba istaći ned
- Page 308 and 309: Slika 7 Što se tiĉe "Voćarske" p
- Page 312 and 313: procedure takes into account the co
- Page 314 and 315: The denominator in equation (17) is
- Page 316 and 317: Accuracy comparison of the observat
- Page 318 and 319: Number of valid observations [%] Š
- Page 320 and 321: ANALIZA PRIRODNO-GEOLOŠKIH USLOVA
- Page 322 and 323: Za pripremne rudarske prostorije, k
- Page 324 and 325: Tabela 2. Overene rezerve uglja u n
- Page 326 and 327: ANALIZA PROMENE HIDROGEOLOŠKIH USL
- Page 328 and 329: NO 2 manje od 0,01 pH 7,35 Ukupna m
- Page 330 and 331: Slika 3: Situacioni deo OP-1 i OP-4
- Page 332 and 333: METODOLOGIJA UVOĐENJA NOVIH METODA
- Page 334 and 335: Zbog toga je za otkopavanje ove gru
- Page 336 and 337: Rez ult ati/ Me sec: R. Av br. gus
- Page 338 and 339: R. br . 1. Tabela br.2: Potrošnja
- Page 340 and 341: PREGLED POSTOJEĆEG STANJA 1.1. Teh
- Page 342 and 343: PREDLOG METODOLOGIJE ODREĐIVANJA C
- Page 344 and 345: NAĈIN OTVARANJA, RAZRADE I EKSPLOA
- Page 346 and 347: • Padni ugao ugljenog sloja se me
- Page 348 and 349: Slika 3. Karakteristiĉni profil ug
- Page 350 and 351: dela leţista, sa usmerenjem prema
- Page 352 and 353: Generalno gledano otkopavanje uglje
- Page 354 and 355: UTICAJ NA ŢIVOTNU SREDINU ZVUĈNIH
- Page 356 and 357: Za vazdušni udrani talas karakteri
- Page 358 and 359: 4.1. Seizmiĉko dejstvo Na bazi eks
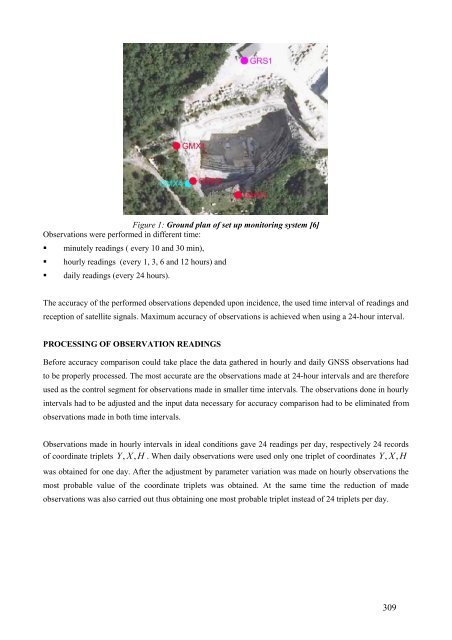
Figure 1: Ground plan of set up monitoring system [6]<br />
Observations were performed in different time:<br />
• minutely readings ( every 10 and 30 min),<br />
• hourly readings (every 1, 3, 6 and 12 hours) and<br />
• daily readings (every 24 hours).<br />
The accuracy of the performed observations depended upon incidence, the used time interval of readings and<br />
reception of satellite signals. Maximum accuracy of observations is achieved when using a 24-hour interval.<br />
PROCESSING OF OBSERVATION READINGS<br />
Before accuracy comparison could take place the data gathered in hourly and daily GNSS observations had<br />
to be properly processed. The most accurate are the observations made at 24-hour intervals and are therefore<br />
used as the control segment for observations made in smaller time intervals. The observations done in hourly<br />
intervals had to be adjusted and the input data necessary for accuracy comparison had to be eliminated from<br />
observations made in both time intervals.<br />
Observations made in hourly intervals in ideal conditions gave 24 readings per day, respectively 24 records<br />
of coordinate triplets Y, X , H . When daily observations were used only one triplet of coordinates Y, X , H<br />
was obtained for one day. After the adjustment by parameter variation was made on hourly observations the<br />
most probable value of the coordinate triplets was obtained. At the same time the reduction of made<br />
observations was also carried out thus obtaining one most probable triplet instead of 24 triplets per day.<br />
309


