Poljoprivreda 2-2006 final.qxd
Poljoprivreda 2-2006 final.qxd
Poljoprivreda 2-2006 final.qxd

You also want an ePaper? Increase the reach of your titles
YUMPU automatically turns print PDFs into web optimized ePapers that Google loves.
A. Sudarić et. al.: EVALUATION OF AGRONOMIC PERFORMANCE OF DOMESTIC AND ...<br />
19<br />
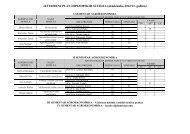
Table 1. Monthly mean air temperatures (°C) and monthly total precipitation (mm) in Osijek, Croatia during soybean<br />
the growing season for the period from 2002 to 2005 and average values for the period 1971-2000<br />
Tablica 1. Srednje mjesečne temperature zraka (°C) i ukupna mjesečna količina oborina (mm) po godinama tijekom vegetacije<br />
soje 2002. do 2005. te za prosjek razoblja 1971.-2000., Osijek (Hrvatska)<br />
pitation) for the investigated period (2002-2005) as well<br />
as 30-year average over soybean growing season at<br />
location Osijek are presented in Table 1.<br />
RESULTS AND DISCUSSION<br />
Mean values for investigated growing season,<br />
grain yield components, lodging and intensity of downy<br />
mildew on leaf and seed of tested cultivars expressed<br />
as 4-year averages with results of statistical analysis<br />
are presented in Table 2. The results showed significant<br />
differences among tested cultivars in the mean values of<br />
analyzed traits, except intensity of downy mildew on<br />
leaf, suggesting a level of genetic diversity among the<br />
tested materials. OS-cultivars had significantly longer<br />
vegetation period, were taller and had higher 1000-seed<br />
weight than CA-cultivars. There was no statistical difference<br />
between OS-cultivars and CA-cultivars for number<br />
of nodes per plant, lodging resistance and field tolerance<br />
of Peronospora manshurica.<br />
As a whole, the summarized data for investigated<br />
traits indicated considerably higher agronomic values of<br />
OS-cultivars compared to agronomic values of CA-cultivars.<br />
CA-cultivars had shorter vegetation period than<br />
OS-cultivars, which is a positive trait in breeding for<br />
early maturity.<br />
The average grain yield of 30 tested cultivars<br />
across four experimental years and the overall average<br />
of study with results of statistical analysis are summarized<br />
in Table 3. From this table, it is evident that there<br />
are significant differences in grain yield among tested<br />
genotypes across experimental years and in 4-year average,<br />
which has probably been caused by differences in<br />
the genetic background within the experimental material.<br />
Among the 30 cultivars, four significantly higher grain<br />
yield in relation to the trial average, while 10 cultivars<br />
(8CA;2OS) had statistical significant lower grain yield<br />
than the trial average. Yield of the other cultivar<br />
(10OS;11CA) had been on the level of the cultivars<br />
(3OS;1CA) that had trial average. By the overall trial<br />
average, the OS-cultivars had statistical significant<br />
higher grain yield (4322.5 kgha -1 ) than CA-cultivars<br />
(3718 kgha -1 ), which may be a reflection of much longer<br />
growing season for the OS-cultivars.<br />
Apart from genetic differences, grain yield was<br />
also affected by various climatic conditions during soybean<br />
growing season (Tab. 3), being evidently from<br />
considerable differences among the average values of<br />
grain yield per experimental years. Different environmental<br />
conditions throughout the study affected the<br />
grain yield of each cultivar, thereby GEI at each cultivar,<br />
was significant. Generally, the results for grain yield<br />
indicated that phenotypic variability for this trait is<br />
dependent on genetic factors, environmental variables,<br />
and the interaction between genotype and environment.<br />
These results corresponded well with findings reported<br />
earlier (Vratarić et al. 2005, <strong>2006</strong>; Sudarić et al., 2005,<br />
<strong>2006</strong>; Yan and Rajcan, 2002, 2003).<br />
According to the stability analysis for grain yield<br />
(Tab. 3), the cultivars could be grouped into three<br />
groups by their differences in stability and adaptability.<br />
The first group of cultivars (8OS;4CA) was characterized<br />
by lower individual values of S 2 GxY<br />
than the trial average<br />
value of S 2 GxY and value b i<br />
of bout 1.0 which indicated<br />
considerable grain yield stability over diverse environmental<br />
conditions. The group of unstable cultivars consisted<br />
of 18 cultivars (Tab. 3), which had individual<br />
values of S 2 GxY higher than the average values S2 GxY of<br />
trials, which indicated considerable variation in this trait<br />
as affected by environmental factors. Furthermore, the<br />
tested genotypes differed in their reaction on the environmental<br />
changes. Nine cultivars (4OS;5CA), had a<br />
b i<br />
1.3 or below-average stability. Therefore,<br />
these lines will have higher grain yield than the<br />
average value in favorable environments, while in unfavorable<br />
environments their grain yield will be below the<br />
average. Such cultivars are classified as being narrowly<br />
adaptable to high-yielding environments.<br />
POLJOPRIVREDA 12:<strong>2006</strong> (2) 17-22