Innehåll 1 Sannolikhetsteori - Matematikcentrum
Innehåll 1 Sannolikhetsteori - Matematikcentrum
Innehåll 1 Sannolikhetsteori - Matematikcentrum

You also want an ePaper? Increase the reach of your titles
YUMPU automatically turns print PDFs into web optimized ePapers that Google loves.
2 INFERENSTEORI<br />
51. [∗] En fysiker har gjort fem mätningar för att bestämma en fysikalisk konstant m. Mätningarna<br />
kan anses vara observationer av en normalfördelad stokastisk variabel med väntevärde m och känd<br />
standardavvikelse. Hon fick ett 90 % konfidensintervall (7.02, 7.14), vilket hon tyckte var för brett<br />
och hade för låg konfidensgrad. Hur många fler mätningar behövs för att få ett konfidensintervall<br />
som har konfidensgrad<br />
(a) 90 % och som är hälften så brett<br />
(b) 95 % och som har ungefär samma bredd<br />
52. [∗] The distance between A and C is measured in 2 stages: namely, AB and BC as shown in the<br />
figure. Measurements on AB and BC are recorded as follows:<br />
AB: 100.5, 99.6, 100.1, 100.3, 99.5 m<br />
BC: 50.2, 49.8, 50.0 m<br />
A B C<br />
(a) Compute the sample mean and sample variance of the measured distances for AB.<br />
(b) Compute the standard error of the estimated distance of AB.<br />
(c) Establish an approximate 98 % confidence interval for the actual distance AB.<br />
(d) If the distance AC is given by the sum of the estimated distances AB and BC, that is AC = AB<br />
+ BC, what is the standard error of the estimated total distance between A and C<br />
(e) Establish an approximate 98 % confidence interval on the actual length AC.<br />
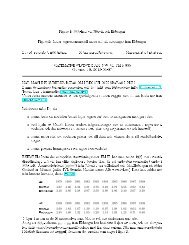
53. Assume hypothetically that the concentration of dissolved solids and the turbidity of a stream are<br />
measured simultaneously for five separate days, selected at random throughout a year. The data are<br />
as follows.<br />
Day Dissolved solids Turbidity<br />
(mg/l) (JTU)<br />
1 400 5<br />
2 550 30<br />
3 700 32<br />
4 800 58<br />
5 500 20<br />
Because turbidity is easier to measure, a regression equation may be used to predict the concentration<br />
of dissolved solids on the basis of known turbidity. Assume that the variance of dissolved solid<br />
concentration is constant with turbidity.<br />
(a) What are the values of the intercept and slope parameters (and) of the regression line<br />
(b) Estimate the standard deviation of dissolved solid concentration about the regression line.<br />
54. Antag att data på vattenkonsumtion per dag och per capita har insamlats för fyra städer och sammanställts<br />
i tabell enligt följande (se också figur)<br />
14