Rapporten från etapp 1 - BeBo
Rapporten från etapp 1 - BeBo
Rapporten från etapp 1 - BeBo

Create successful ePaper yourself
Turn your PDF publications into a flip-book with our unique Google optimized e-Paper software.
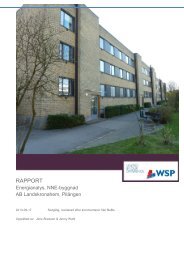
Pressure Drop (Pa)<br />
120<br />
100<br />
80<br />
60<br />
40<br />
20<br />
Small Duct vs Large Duct<br />
0<br />
0 2 4 6 8 10 12<br />
Air Flow (liters per sec)<br />
Figure 7. Duct area comparison at Length 3<br />
Discussion:<br />
Small Duct Large Duct<br />
Table 2 Laboratory Sound Tests<br />
Air Flow Octave Frequency Decibels<br />
~7 l/s A 125 Hz 42 dB<br />
~7 l/s A 250 Hz 42 dB<br />
~7 l/s A 500 Hz 42 dB<br />
~12 l/s A 125 Hz 42 dB<br />
~12 l/s A 250 Hz 42 dB<br />
~12 l/s A 500 Hz 42 dB<br />
Upon observing the results, several points can be made. With Figure 1, the small area<br />
duct results, the pressure drop at seven liters per second air flow is most interesting. This<br />
air flow is required for proper ventilation as these ducts will be used as radial ducts<br />
stemming from a larger area duct. The air speed measurement is approximately 0,9<br />
meters per second theoretically, but the observed value is a bit to the left of the curve.<br />
This is due to the placement of the air speed instrument which is set before the fan and<br />
before all the air silencing equipment. It is believed that the speed was slightly reduced in<br />
the ducts after passing through all the equipment, as well; air speed readings were<br />
averaged over the length of time with possible recording errors.<br />
Bilaga 5 sid 5 (6)<br />
5<br />
14