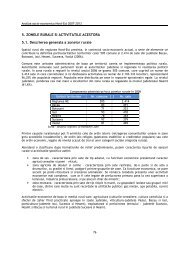
IMM-urile aduc cel mai mare aport la cifra <strong>de</strong> afaceri totala regionala in sectorul hotelurilor sirestaurantelor cu 61.53%.Cifra <strong>de</strong> afaceri a unitatilor locale active pe activitati si clase <strong>de</strong> marime 2007milioane RON preturi%curenteTotal 0-9 10-249 >250 0-9 10-249 >250Total Regiunea <strong>Nord</strong>-<strong>Est</strong> 56108 12304 31859 11945 21,93 56,78 21,29Industrie extractiva 497 19 217 261 3,82 43,66 52,52Industrie prelucratoare 14643 1128 7061 6454 7,70 48,22 44,08Energie electrica si termica,gaze si apa 2606 24 1103 1479 0,92 42,33 56,75Constructii 5895 661 3953 1281 11,21 67,06 21,73Comert, reparatii auto si bunuri 26104 8107 16361 1636 31,06 62,67 6,27Hoteluri si restaurante 759 292 467 - 38,47 61,53 -Transport, <strong>de</strong>pozitare sitelecomunicatii 2812 775 1289 748 27,56 45,84 26,60Tranzactii imobiliare, inchirieri,servicii 2065 1041 973 51 50,41 47,12 2,47Invatamant 41 25 16 - 60,98 39,02 -Sanatate si asistenta sociala 190 95 95 - 50,00 50,00 -Servicii colective, sociale sipersonale 496 137 324 35 27,62 65,32 7,06Sursa: Anuarul Statistic al Romaniei <strong>2008</strong>In Regiunea <strong>Nord</strong> <strong>Est</strong> indicele <strong>de</strong> utilizare a capacitatii in functiune inregistreaza o traiectoriesinusoidala <strong>de</strong> la 31.7% in anul 2000 pana la 30.3% in anul 2007.Situatia asupra capacitatii si activitatii <strong>de</strong> cazare turistica in 2000-2007Capacitatea <strong>de</strong>cazare Infunctiune(mii locurizile)Sosiri(mii)DincareturististrainiInnoptari (mii)DincareturististrainiIndice <strong>de</strong>utilizare acapacitatii infunctiune(%)Duratamedie<strong>de</strong>se<strong>de</strong>re(nopti/turist)Duratamedie <strong>de</strong>se<strong>de</strong>re(nopti/turiststrain)<strong>Nord</strong> <strong>Est</strong>4624 543 1468 31,7 2.7Romania 2000 50197 4920 17647 35,2 3.59<strong>Nord</strong> <strong>Est</strong>4651 535 1406 30.2 2.62Romania 2001 51882 4875 18122 34.9 3.71<strong>Nord</strong> <strong>Est</strong>4615 535 1332 28.9 2.48Romania 2002 50752 4847 17277 34 3.56<strong>Nord</strong> <strong>Est</strong>4963 553 1450 29.2 2.62Romania 2003 51632 5056 17845 34.6 3.52<strong>Nord</strong> <strong>Est</strong>5049 618 111 1489 214 29.5 2.41 1.93Romania 2004 53988 5638 1359 18500 3333 34.3 3.28 2.45<strong>Nord</strong> <strong>Est</strong>5284 621 109 1435 207 27.2 2.31 1.9Romania 2005 54978 5805 1429 18372 3464 33.4 3.16 2.42<strong>Nord</strong> <strong>Est</strong>5528 98 1599 191 28.9 2.36 1.95Romania 2006 56499 6216 1379 18991 3242 33.6 3.05 2.35<strong>Nord</strong> <strong>Est</strong>5583 718 110 1692 213 30.3 2.36 1.942007Romania 57138 6972 1551 20593 3586 36.0 2.95 2.31Sursa: Anuare Statistice ale Romaniei 2001-<strong>2008</strong>, Publicatii INS 2005 -<strong>2008</strong>54
De asemenea, se remarca faptul ca in perioada 2000-2005 se inregistreaza o sca<strong>de</strong>re a numarului<strong>de</strong> innoptari <strong>de</strong> la 1468 mii persoane in 2000 la 1435 mii persoane in anul 2005, dar anii 2006 si2007 sunt caracterizati <strong>de</strong> o crestere importanta <strong>de</strong> 11.42%, respectiv 5.8% a numarului <strong>de</strong>innoptari.Durata medie <strong>de</strong> se<strong>de</strong>re pe turist la nivelul anului 2007 este <strong>de</strong> 2.36 nopti/turist, insa valorile suntinferioare atat valorii nationale cat si din celelalte regiuni, cu exceptia regiunii Bucuresti –Ilfov ceinregistreaza cea mai mica valoare a indicatorului <strong>de</strong> numai 2.03 nopti/turist.Se remarca faptul ca in perioada 2000-2005 durata medie <strong>de</strong> se<strong>de</strong>re a inregistrat o sca<strong>de</strong>recontinua atat la nivel national cat si regional, dar anul 2006 este caracterizat <strong>de</strong> o usoara cresterea duratei medii <strong>de</strong> se<strong>de</strong>re in Regiunea <strong>Nord</strong>-<strong>Est</strong>, <strong>de</strong>si la nivel national evolutia <strong>de</strong>scen<strong>de</strong>nta acontinuat. Din situatia prezentata se constata si o sca<strong>de</strong>re continua a numarului <strong>de</strong> turisti strainicare viziteaza regiunea, insotita <strong>de</strong> o crestere a celor autohtoni.Analiza evolutiei indicatorilor economico-sociali din turism in Regiunea N-E in lunaaugust in perioada a anilor 2004-20071Analiza evolutiei indicatorului sosiri in structurile <strong>de</strong> primire turistica, pon<strong>de</strong>rea ju<strong>de</strong>telor inRegiunea <strong>Nord</strong>-<strong>Est</strong> indica situarea <strong>de</strong>tasata pe primele doua pozitii, a ju<strong>de</strong>telor Suceava cu 35,5%si Neamt cu 28,4% din totalul Regiunii <strong>Nord</strong>-<strong>Est</strong>. Pe ultimele doua pozitii se situeaza ju<strong>de</strong>tulBotosani cu 4% si ju<strong>de</strong>tul Vaslui cu 3.5%.In ceea ce priveste evolutia pon<strong>de</strong>rilor se remarca o diminuare a pon<strong>de</strong>rii ju<strong>de</strong>tului Suceava <strong>de</strong> la39,2% in august 2005 la 36,8% in august 2006 respectiv la 35,5% in august 2007. Exceptand august2004, ju<strong>de</strong>tul Neamt a inregistrat un trend ascen<strong>de</strong>nt, <strong>de</strong> la 23,0% in august 2005 la 28,4% inaugust 2007.<strong>Est</strong>e <strong>de</strong> remarcat faptul ca, ju<strong>de</strong>tele Botosani si Vaslui au inregistrat o crestere a pon<strong>de</strong>rilor inaugust 2007 comparativ cu august 2006, spre <strong>de</strong>osebire <strong>de</strong> ju<strong>de</strong>tele Bacau si Iasi care auinregistrat sca<strong>de</strong>ri.Sosiri - Pon<strong>de</strong>rea ju<strong>de</strong>telor in Regiunea <strong>Nord</strong>-<strong>Est</strong> (%)Ju<strong>de</strong>tul aug.07 aug.06 aug.05 aug.04Bacau 14,8 15,1 15,6 16,4Botosani 4,0 2,9 3,0 3,2Iasi 13,7 15,3 15,9 15,6Neamt 28,4 27,3 23,0 26,1Suceava 35,5 36,8 39,2 35,7Vaslui 3,5 2,7 3,3 3,0Reg. N-E 100 100 100 100Sursa: Comisia Nationala <strong>de</strong> Prognoza <strong>Nord</strong>-<strong>Est</strong> Piatra Neamt, noiembrie 2007In ceea ce priveste analiza evolutiei indicatorului – innoptari in structurile <strong>de</strong> primire turistica,pon<strong>de</strong>rea ju<strong>de</strong>telor indica situarea pe primele doua pozitii a ju<strong>de</strong>telor Suceava cu 35,1% si Neamt1 Date furnizate <strong>de</strong> catre Comisia Nationala <strong>de</strong> Prognoza <strong>Nord</strong>-<strong>Est</strong> Piatra Neamt55
- Page 1 and 2:
Planul Regional de Actiunepentru Tu
- Page 3 and 4: • Theodor Robu• Ioan Itco• Da
- Page 5 and 6: SECTIUNEA IANALIZA SITUATIEI CURENT
- Page 7 and 8: ClimaDiferitele tipuri de relief cr
- Page 9 and 10: izvor cu apa dulce, ce contine elem
- Page 11 and 12: din punct de vedere arhitectural, s
- Page 13 and 14: Teatrul National a fost construit p
- Page 15 and 16: Judetul SuceavaCetatea de Scaun a S
- Page 18 and 19: Distributia judeteana a numarului s
- Page 20 and 21: Centrul International de Cultura si
- Page 22 and 23: principale - agricultura, viticultu
- Page 24 and 25: Muzeul Diecezan al Catolicilor din
- Page 26 and 27: prilej de intalnire a ansamblurilor
- Page 28 and 29: plimbari in aer liber, jocuri sport
- Page 30 and 31: cailor rutiere intre resedintele de
- Page 32: 20002001200220032004200520062007Str
- Page 36 and 37: Profilul preponderent al tratamentu
- Page 38 and 39: Statiunea Oglinzi este situata la o
- Page 40 and 41: Manifestarile cultural-artistice de
- Page 42 and 43: sculptura si pictura de mare valoar
- Page 44 and 45: evenimentelor specifice locului (se
- Page 46 and 47: profita de prilejul deplasarii in s
- Page 48 and 49: I.3 ANALIZA SITUATIEI MARKETINGULUI
- Page 50 and 51: Din situatia prezentata mai sus se
- Page 52 and 53: Ghizii de turism trebuie sa se cali
- Page 56 and 57: cu 25,8% din totalul Regiunii Nord-
- Page 58 and 59: 26,3%. De remarcat, este faptul ca,
- Page 60 and 61: II.1. Turismul international in cif
- Page 62 and 63: Federatia Rusa si Republica Ceha, f
- Page 64 and 65: Cresterea preocuparilor pentru sana
- Page 66 and 67: Siguranta si securitateaActele de t
- Page 68 and 69: Puncte tari• Regiunea beneficiaza
- Page 70 and 71: SECTIUNEA IVDIRECTIILE STRATEGICE D
- Page 72 and 73: • Crearea si dezvoltarea unei ima
- Page 74 and 75: SECTIUNEA VPORTOFOLIUL DE PROIECTE
- Page 76 and 77: Nr.crt.910Proiect/actiune Obiectiv
- Page 78 and 79: Nr.crt.2223242526Proiect/actiune Ob
- Page 80 and 81: Nr.crt.Proiect/actiune Obiectiv Res
- Page 82 and 83: Nr.crt.49Proiect/actiune Obiectiv R
- Page 84 and 85: Nr.crt.Proiect/actiune Obiectiv Res
- Page 86 and 87: Nr.crt.787980818283Proiect/actiune
- Page 88 and 89: Nr.crt.Proiect/actiune Obiectiv Res
- Page 90 and 91: Nr.crt.Proiect/actiune Obiectiv Res
- Page 92 and 93: Nr.crt.Proiect/actiune Obiectiv Res
- Page 94 and 95: Nr.crt.Proiect/actiune Obiectiv Res
- Page 96 and 97: Nr.crt.Proiect/actiune Obiectiv Res
- Page 98 and 99: Nr.crt.Proiect/actiune Obiectiv Res
- Page 100 and 101: Nr.crt.Proiect/actiune Obiectiv Res
- Page 102 and 103: 1. Retea de excelenta pentru dezvol
- Page 104 and 105:
parteneriatul format este interesat
- Page 106 and 107:
cooperare structurata si periodica
- Page 108 and 109:
• un depozit de cunostinte despre
- Page 110 and 111:
AplicantParteneriate - ADR Nord-Est
- Page 112 and 113:
SECTIUNEA VIIICADRUL DE PLANIFICARE
- Page 114 and 115:
Nr.crt.10 Catalin IlascuMembru GTRD
- Page 116 and 117:
Anexa I - Circuite turistice judete
- Page 118 and 119:
veteranilor de război din 1877, 19
- Page 120 and 121:
Bogata viata etno-folclorica a loca
- Page 122 and 123:
Botosani - Dorohoi- Casa memoriala
- Page 124 and 125:
arhitectului Louis Blanc, sub condu
- Page 126 and 127:
"Inaltarea Domnului" a fost refacut
- Page 128 and 129:
Piatra Neamt - Bicaz - CeahlauOBIEC
- Page 130 and 131:
De-a lungul timpului manastirea a s
- Page 132 and 133:
Indicatii terapeutice ale apelor mi
- Page 134 and 135:
In cele 16 sali si 2 holuri sunt ex
- Page 136 and 137:
Solesti - Biserica „Adormirea Mai
- Page 138 and 139:
Teodor, langa biserica veche a schi
- Page 140 and 141:
Husi - Padureni - Dimitrie Cantemir
- Page 142 and 143:
Bicaz - Muzeul de Istorie si Etnogr
- Page 144 and 145:
Manastirea Cetatuia a fost ctitorit
- Page 146 and 147:
Palatul Comunal care a fost constru
- Page 148 and 149:
Balcanice. Ansamblul megalitic, con
- Page 150 and 151:
Posibilitatile de practicare a turi
- Page 152 and 153:
Tg. Neamt Cetatea Neamtului - Const
- Page 154 and 155:
catre ing. Dimitrie Leonida. Are o
- Page 156 and 157:
Mitropolia Moldovei si BucovineiMit
- Page 158 and 159:
mănăstire, fiind redeschisă la 6
- Page 160 and 161:
În casa muzeu sunt găzduite numer
- Page 162 and 163:
carbunoase si carbuni ce afloreaza
- Page 164 and 165:
Harlau Biserica „Sfantul Gheorghe
- Page 166 and 167:
Piatra-NeamtMuzeul de Arta Eneoliti
- Page 168 and 169:
Plaiurile si stincariile Nemirei -
- Page 170 and 171:
Piatra-Neamt si imprejurimi Piatra
- Page 172 and 173:
Durau - Situata la 100 km de Piatra
- Page 174 and 175:
in centrul statiunii Vatra Dornei c
- Page 176 and 177:
O solutia ar fi marcarea de culoare
- Page 178 and 179:
Nr.crtDenumireaLocalizarePojorata,
- Page 180:
180


