You also want an ePaper? Increase the reach of your titles
YUMPU automatically turns print PDFs into web optimized ePapers that Google loves.
2.2. Grafice tridimensionale 69<br />
y<br />
1<br />
0.5<br />
0<br />
−0.5<br />
sin(3 y−x 2 +1)+cos(2 y 2 −2 x)<br />
−1<br />
−2 −1.5 −1 −0.5 0<br />
x<br />
0.5 1 1.5 2<br />
1<br />
0.5<br />
0<br />
−0.5<br />
−1<br />
−2 −1.5 −1 −0.5 0 0.5 1 1.5 2<br />
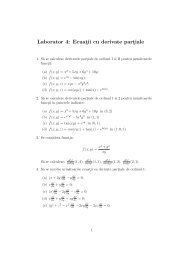
Figura 2.14: Contururi obt¸inute cu ezcontour (sus) s¸i contour (jos).<br />
t = -5:0.005:5;<br />
x = (1+t.ˆ2).*sin(20*t);<br />
y = (1+t.ˆ2).*cos(20*t);<br />
z=t;<br />
plot3(x,y,z)<br />
grid on<br />
xlabel(’x(t)’), ylabel(’y(t)’), zlabel(’z(t)’)<br />
title(’{\itExemplu} plot3’,’FontSize’,14)<br />
Acest exemplu utilizează funct¸iile xlabel, ylabel s¸i title, precum s¸i analogul<br />
lor zlabel. De notat s¸i utilizarea notat¸iei TEX în titlu, pentru a produce text<br />
italic. Culoarea, marcajul s¸i stilul de linie pentru plot3 se controlează la fel ca pentru<br />
plot. Limitele de axe în spat¸iul tridimensional se determină automat, dar ele pot<br />
fi schimbate cu<br />
axis([xmin, xmax, ymin, ymax, zmin, zmax])<br />
Înafară de xlim s¸i ylim, există s¸i zlim, prin care se pot schimba limitele pe axaz.<br />
O facilitate us¸or de utilizat de desenare a contururilor este oferită de<br />
ezcontour. Apelul lui ezcontour în exemplul următor produce contururi pentru<br />
funct¸ia sin(3y − x 2 + 1) + cos(2y 2 − 2x) pe domeniul dat de −2 ≤ x ≤ 2 s¸i<br />
−1 ≤ y ≤ 1; rezultatul se poate vedea în jumătatea de sus a figurii 2.14.<br />
subplot(211)<br />
ezcontour(’sin(3*y-xˆ2+1)+cos(2*yˆ2-2*x)’,[-2,2,-1,1]);<br />
%<br />
x=-2:.01:2; y=-1:0.01:1;