Gastroenterology Today Winter 2023
Gastroenterology Today Winter 2023
Gastroenterology Today Winter 2023

You also want an ePaper? Increase the reach of your titles
YUMPU automatically turns print PDFs into web optimized ePapers that Google loves.
Peng et al. BMC <strong>Gastroenterology</strong> (<strong>2023</strong>) 23:219<br />
FEATURE<br />
Page 5 of 9<br />
Peng et al. BMC <strong>Gastroenterology</strong> (<strong>2023</strong>) 23:219<br />
Page 6 of 9<br />
FEATURE<br />
GASTROENTEROLOGY TODAY – WINTER <strong>2023</strong><br />
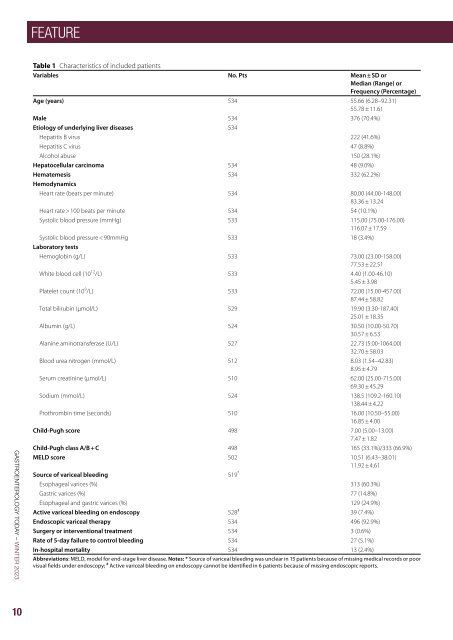
Table 1 Characteristics of included patients<br />
Variables No. Pts Mean ± SD or<br />
Median (Range) or<br />
Frequency (Percentage)<br />
Age (years) 534 55.66 (6.28–92.31)<br />
55.78 ± 11.61<br />
Male 534 376 (70.4%)<br />
Etiology of underlying liver diseases 534<br />
Hepatitis B virus 222 (41.6%)<br />
Hepatitis C virus 47 (8.8%)<br />
Alcohol abuse 150 (28.1%)<br />
Hepatocellular carcinoma 534 48 (9.0%)<br />
Hematemesis 534 332 (62.2%)<br />
Hemodynamics<br />
Heart rate (beats per minute) 534 80.00 (44.00-148.00)<br />
83.36 ± 13.24<br />
Heart rate > 100 beats per minute 534 54 (10.1%)<br />
Systolic blood pressure (mmHg) 533 115.00 (75.00-176.00)<br />
116.07 ± 17.59<br />
Systolic blood pressure < 90mmHg 533 18 (3.4%)<br />
Laboratory tests<br />
Hemoglobin (g/L) 533 73.00 (23.00-158.00)<br />
77.53 ± 22.51<br />
White blood cell (10 12 /L) 533 4.40 (1.00-46.10)<br />
5.45 ± 3.98<br />
Platelet count (10 9 /L) 533 72.00 (15.00-457.00)<br />
87.44 ± 58.82<br />
Total bilirubin (µmol/L) 529 19.90 (3.30-187.40)<br />
25.01 ± 18.35<br />
Albumin (g/L) 524 30.50 (10.00-50.70)<br />
30.57 ± 6.53<br />
Alanine aminotransferase (U/L) 527 22.73 (5.00-1064.00)<br />
32.70 ± 58.03<br />
Blood urea nitrogen (mmol/L) 512 8.03 (1.54–42.83)<br />
8.95 ± 4.79<br />
Serum creatinine (µmol/L) 510 62.00 (25.00-715.00)<br />
69.30 ± 45.29<br />
Sodium (mmol/L) 524 138.5 (109.2-160.10)<br />
138.44 ± 4.22<br />
Prothrombin time (seconds) 510 16.00 (10.50–55.00)<br />
16.85 ± 4.00<br />
Child-Pugh score 498 7.00 (5.00–13.00)<br />
7.47 ± 1.82<br />
Child-Pugh class A/B + C 498 165 (33.1%)/333 (66.9%)<br />
MELD score 502 10.51 (6.43–38.01)<br />
11.92 ± 4.61<br />
Source of variceal bleeding 519 *<br />
Esophageal varices (%) 313 (60.3%)<br />
Gastric varices (%) 77 (14.8%)<br />
Esophageal and gastric varices (%) 129 (24.9%)<br />
Active variceal bleeding on endoscopy 528 # 39 (7.4%)<br />
Endoscopic variceal therapy 534 496 (92.9%)<br />
Surgery or interventional treatment 534 3 (0.6%)<br />
Rate of 5-day failure to control bleeding 534 27 (5.1%)<br />
In-hospital mortality 534 13 (2.4%)<br />
Abbreviations: MELD, model for end-stage liver disease. Notes: * Source of variceal bleeding was unclear in 15 patients because of missing medical records or poor<br />
visual fields under endoscopy; # Active variceal bleeding on endoscopy cannot be identified in 6 patients because of missing endoscopic reports.<br />
Table 2 Outcomes according to the timing of endoscopy defined as the interval from the last presentation of AVB to endoscopy<br />
Overall analysis<br />
< 12h ≥ 12h P value < 24h ≥ 24h P value < 48h ≥ 48h P value<br />
(N = 55) (N = 434)<br />
(N = 114) (N = 357)<br />
(N = 226) (N = 242)<br />
Rate of 5-day failure to control bleeding 6 (10.9%) 14 (3.2%) 0.007 15 (13.2%) 8 (2.2%) < 0.001 20 (8.8%) 5 (2.1%) 0.001<br />
In-hospital mortality 5 (9.1%) 6 (1.4%) < 0.001 6 (5.3%) 6 (1.7%) 0.035 8 (3.5%) 5 (2.1%) 0.332<br />
PSM analysis<br />
hematemesis, systolic blood pressure < 90 mmHg, Child-<br />
Multivariate logistic regression analysis demonstrated that the interval<br />
Pugh class B/C, and active variceal bleeding on endoscopy,<br />
white blood cell, and blood urea nitrogen than<br />
from last presentation of AVB to endoscopy < 12 h was not significantly<br />
associated with 5-day failure to control bleeding (OR = 2.889, 95% CI:<br />
delayed endoscopy group (Supplementary Table 5). Early<br />
0.912–9.151; P = 0.071). Multivariate Cox regression analysis showed<br />
endoscopy group had a significantly higher rate of 5-day<br />
that the interval from last presentation of AVB to endoscopy < 12 h was<br />
failure to control bleeding than delayed endoscopy group,<br />
not significantly associated with in-hospital death (HR = 2.828, 95% CI:<br />
but a statistically similar in-hospital mortality (Table 2).<br />
0.706–11.320, P = 0.142).<br />
Multivariate logistic regression analysis demonstrated<br />
that the interval from last presentation of AVB to endoscopy<br />
< 48 h was significantly associated with a higher rate<br />
In the PSM analysis, 46 patients were matched to each group<br />
(Supplementary Table 2). There was no significant difference in rate of<br />
of 5-day failure to control bleeding (OR = 4.171, 95% CI:<br />
5-day failure to control bleeding or in-hospital mortality between the<br />
1.486–11.708; P = 0.007). Cox regression analysis showed<br />
two groups (Table 2).<br />
that the interval from last presentation of AVB to endoscopy<br />
< 48 h was not significantly associated with in-hospital<br />
death (HR = 0.808, 95% CI: 0.237–2.750, P = 0.733).<br />
< 24 h versus ≥ 24 h. In the overall-analysis, early endoscopy group<br />
was significantly older and had higher proportions of HCV infection,<br />
In the PSM analysis, 165 patients were matched to each<br />
hematemesis, systolic blood pressure < 90 mmHg, Child-Pugh class<br />
group (Supplementary Table 6). Early endoscopy group<br />
B/C, and active variceal bleeding on endoscopy and white blood<br />
had a significantly higher rate of 5-day failure to control<br />
cell than delayed endoscopy group (Supplementary Table 3). Early<br />
bleeding than delayed endoscopy group, but a statistically<br />
endoscopy group had significantly higher rate of 5-day failure to control<br />
similar in-hospital mortality (Table 2).<br />
bleeding and in-hospital mortality than delayed endoscopy group<br />
(Table 2).<br />
Time to endoscopy according to the interval from the<br />
admission to endoscopy<br />
Multivariate logistic regression analysis demonstrated that the interval<br />
< 12 h versus ≥ 12 h. In the overall-analysis, early endoscopy<br />
group was significantly older and had significantly<br />
from last presentation of AVB to endoscopy < 24 h was associated with a higher rate of 5-day failure to control bleeding (OR =<br />
higher proportions of HCV infection, Child-Pugh class<br />
6.065, 95% CI: 2.336–15.749; P < 0.001). Multivariate Cox regression<br />
B/C, and active variceal bleeding on endoscopy, white<br />
analysis showed that the interval from last presentation of AVB to<br />
blood cell, total bilirubin, blood urea nitrogen, Childendoscopy<br />
< 24 h was not significantly associated with in-hospital<br />
Pugh score, and MELD score than delayed endoscopy<br />
death (HR = 1.400, 95% CI: 0.403–4.860, P = 0.597).<br />
group (Supplementary Table 7). There was no significant<br />
difference in rate of 5-day failure to control bleeding or<br />
In the PSM analysis, 97 patients were matched to each group<br />
in-hospital mortality between the two groups (Table 3).<br />
(Supplementary Table 4). There was no significant difference in rate of<br />
5-day failure to control bleeding or in-hospital mortality between the<br />
two groups (Table 2).<br />
< 12h<br />
(N = 46)<br />
≥ 12h<br />
(N = 46)<br />
P value<br />
< 24h<br />
(N = 97)<br />
≥ 24h<br />
(N = 97)<br />
P value<br />
< 48h<br />
(N = 165)<br />
≥ 48h<br />
(N = 165)<br />
Rate of 5-day failure to control bleeding 4 (8.7%) 3 (6.5%) 1.000 13 (13.4%) 6 (6.2%) 0.091 16 (9.7%) 4 (2.4%) 0.009<br />
In-hospital mortality 3 (6.5%) 2 (4.3%) 1.000 4 (4.1%) 3 (3.1%) 1.000 5 (3.0%) 4 (2.4%) 1.000<br />
Abbreviations: AVB, acute variceal bleeding; PSM, propensity score matching<br />
P value<br />
Table 3 Outcomes according to the timing of endoscopy defined as the interval from the admission to endoscopy<br />
Overall analysis<br />
< 12h ≥ 12h P value < 24h ≥ 24h P value < 48h ≥ 48h P value<br />
(N = 75) (N = 453)<br />
(N = 175) (N = 349)<br />
(N = 289) (N = 236)<br />
Rate of 5-day failure to control bleeding 5 (6.7%) 21 (4.6%) 0.451 10 (5.7%) 17 (4.9%) 0.680 13 (4.5%) 13 (5.5%) 0.596<br />
In-hospital mortality 4 (5.3%) 8 (1.8%) 0.055 7 (4.0%) 6 (1.7%) 0.113 8 (2.8%) 5 (2.1%) 0.634<br />
PSM analysis<br />
< 12h<br />
(N = 63)<br />
≥ 12h<br />
(N = 63)<br />
P value<br />
< 24h<br />
(N = 155)<br />
≥ 24h<br />
(N = 155)<br />
P value<br />
< 48h<br />
(N = 199)<br />
≥ 48h<br />
(N = 199)<br />
Rate of 5-day failure to control bleeding 3 (4.8%) 8 (12.7%) 0.205 8 (5.2%) 12 (7.7%) 0.355 9 (4.5%) 12 (6.0%) 0.501<br />
In-hospital mortality 3 (4.8%) 3 (4.8%) 1.000 6 (3.9%) 4 (2.6%) 0.750 4 (2.0%) 5 (2.5%) 1.000<br />
Abbreviations: PSM, propensity score matching<br />
P value<br />
Multivariate logistic regression analysis demonstrated<br />
< 48 h versus ≥ 48 h. In the overall-analysis, early endoscopy group<br />
that the interval from admission to endoscopy < 12 h was<br />
was significantly older and had significantly higher proportions of HCV<br />
not significantly associated with 5-day failure to control<br />
infection, hematemesis, systolic blood pressure < 90 mmHg, Childbleeding<br />
(OR = 0.873, 95% CI: 0.243–3.144; P = 0.836).<br />
Pugh class B/C, and active variceal bleeding on endoscopy, white<br />
blood<br />
Multivariate<br />
cell, and blood<br />
Cox<br />
urea<br />
regression<br />
nitrogen than<br />
analysis<br />
delayed endoscopy<br />
showed that<br />
group<br />
the<br />
(Supplementary<br />
interval from<br />
Table<br />
admission<br />
5). Early<br />
to<br />
endoscopy<br />
endoscopy<br />
group<br />
<<br />
had<br />
12 h<br />
a significantly<br />
was not significantly<br />
higher rate of<br />
associated<br />
5-day failure to<br />
with<br />
control<br />
in-hospital<br />
bleeding than<br />
death<br />
delayed<br />
(HR<br />
endoscopy<br />
= 1.981,<br />
group, 95% CI: but 0.467–8.406, a statistically similar P = 0.354). in-hospital mortality (Table 2).<br />
In the PSM analysis, 63 patients were matched to each<br />
Multivariate group (Supplementary logistic regression Table analysis 8). demonstrated There was that no significant<br />
the interval<br />
from difference last presentation in rate of of AVB 5-day to endoscopy failure to < 48 control h was significantly bleeding or<br />
associated in-hospital with mortality a higher rate between of 5-day the failure two to control groups bleeding (Table(OR<br />
3).<br />
= 4.171, < 2495% h versus CI: 1.486–11.708; ≥ 24 h. P = In 0.007). the Cox overall-analysis, regression analysis early<br />
showed endoscopy that the group interval was from significantly last presentation older of AVB and to endoscopy had significantly<br />
48 h was higher not significantly proportion associated of Child-Pugh with in-hospital class death B/C (HR = and<br />
<<br />
0.808, Child-Pugh 95% CI: 0.237–2.750, score than P delayed = 0.733). endoscopy group (Supplementary<br />
Table 9). There was no significant difference<br />
In in the rate PSM of analysis, 5-day failure 165 patients to control were matched bleeding to each or group in-hospital<br />
(Supplementary mortality between Table 6). the Early two endoscopy groups group (Table had 3). a significantly<br />
higher Multivariate rate of 5-day logistic failure to regression control bleeding analysis than delayed demonstrated<br />
endoscopy<br />
group, that the but interval a statistically from similar admission in-hospital to mortality endoscopy (Table < 2). 24 h was<br />
not significantly associated with 5-day failure to control<br />
Time bleeding to endoscopy (OR = 0.867, according 95% to the CI: interval 0.353–2.132; from the admission P = 0.756).<br />
to Multivariate endoscopy Cox regression analysis showed that the<br />
< interval 12 h versus from ≥ 12 admission h. In the overall-analysis, to endoscopy early < 24 endoscopy h was not group sig-<br />
was significantly associated older and with had significantly in-hospital higher death proportions (HR = of 2.554,<br />
HCV 95% infection, CI: 0.747–8.732, Child-Pugh class P = 0.135). B/C, and active variceal bleeding<br />
on In endoscopy, the PSM white analysis, blood cell, 155 total patients bilirubin, were blood matched urea nitrogen, to each<br />
Child-Pugh group (Supplementary score, and MELD Table score than 10). delayed There was endoscopy no significant group<br />
(Supplementary difference in Table rate 7). of There 5-day was failure no significant to control difference bleeding rate of or<br />
5-day in-hospital failure to mortality control bleeding between or in-hospital the two mortality groups between (Table the 3).<br />
two<br />
<<br />
groups<br />
48 h<br />
(Table<br />
versus<br />
3).<br />
≥ 48 h. In the overall-analysis, early<br />
endoscopy group was significantly older than delayed<br />
Multivariate logistic regression analysis demonstrated that the interval<br />
from admission to endoscopy < 12 h was not significantly associated<br />
GASTROENTEROLOGY TODAY – WINTER <strong>2023</strong><br />
10 11