
Create successful ePaper yourself
Turn your PDF publications into a flip-book with our unique Google optimized e-Paper software.
PANORAMA DO MERCADO IMOBILIÁRIO DO RIO DE JANEIRO <strong>2010</strong><br />
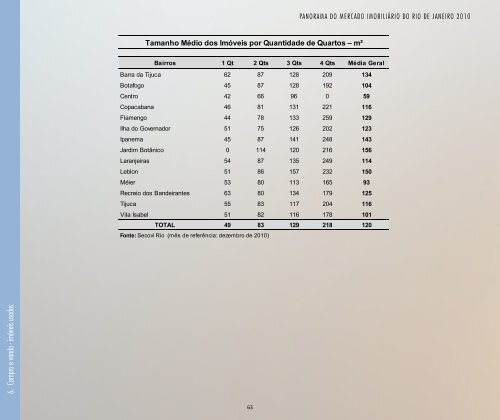
Tamanho Médio <strong>do</strong>s Imóveis por Quantida<strong>de</strong> <strong>de</strong> Quartos – m²<br />
Bairros 1 Qt 2 Qts 3 Qts 4 Qts Média Geral<br />
Barra da Tijuca 62 87 128 209 134<br />
Botafogo 45 87 128 192 104<br />
Centro 42 66 96 0 59<br />
Copacabana 46 81 131 221 116<br />
Flamengo 44 78 133 259 129<br />
Ilha <strong>do</strong> Governa<strong>do</strong>r 51 75 126 202 123<br />
Ipanema 45 87 141 248 143<br />
Jardim Botânico 0 114 120 216 156<br />
Laranjeiras 54 87 135 249 114<br />
Leblon 51 86 157 232 150<br />
Méier 53 80 113 165 93<br />
Recreio <strong>do</strong>s Ban<strong>de</strong>irantes 63 80 134 179 125<br />
Tijuca 55 83 117 204 116<br />
Vila Isabel 51 82 116 178 101<br />
TOTAL 49 83 129 218 120<br />
Fonte: Secovi <strong>Rio</strong> (mês <strong>de</strong> referência: <strong>de</strong>zembro <strong>de</strong> <strong>2010</strong>)<br />
6. Compra e venda - imóveis usa<strong>do</strong>s<br />
63