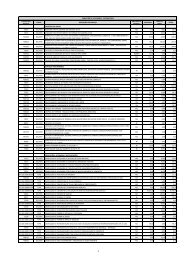
anuario estatistico PR 2009.pdf - Detran - Governo do Paraná
anuario estatistico PR 2009.pdf - Detran - Governo do Paraná
anuario estatistico PR 2009.pdf - Detran - Governo do Paraná

You also want an ePaper? Increase the reach of your titles
YUMPU automatically turns print PDFs into web optimized ePapers that Google loves.
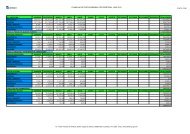
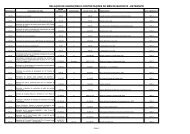
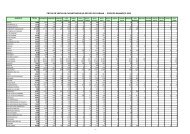
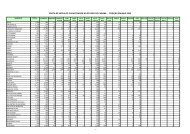
NÚMERO7.0826.5886.9737.7677.6826.079ACIDENTES DE TRÂNSITO EM CURITIBA - 2004 a 2009DADOSANOS2004 2005 2006 2007 2008 2009População1.722.243 1.748.361 1.773.280 1.797.408 1.822.123 1.845.956Frota843.300 907.154 963.464 1.035.819 1.097.830 1.149.456Acidentes com vítimas 7.082 6.588 6.973 7.767 7.682 6.079Vítimas Fatais (1)84 91 83 91 98 72Vítimas não fatais8.846 8.234 8.537 9.568 9.325 7.286Total de vítimas8.930 8.325 8.620 9.659 9.423 7.358ÍNDICESANOS2004 2005 2006 2007 2008 2009Motorização (veículos / 100 habitantes) 48,97 51,89 54,33 57,63 60,25 62,27Mortos por 10.000 veículos 1,00 1,00 0,86 0,88 0,89 0,63Mortos por 100.000 habitantes 4,88 5,20 4,68 5,06 5,38 3,90Mortos por 100 Acidentes com Vítimas 1,19 1,38 1,19 1,17 1,28 1,18Feri<strong>do</strong>s por 1.000 veículos 10,49 9,08 8,86 9,24 8,49 6,34Feri<strong>do</strong>s por 10.000 habitantes 51,36 47,10 48,14 53,23 51,18 39,47Vítimas por 100.000 habitantes 518,51 476,16 486,10 537,38 517,14 398,60Vítimas por 10.000 veículos 105,89 91,77 89,47 93,25 85,83 64,01Vítimas por acidentes com vítimas 1,26 1,26 1,24 1,24 1,23 1,21Acidentes com vítimas por 1000 veículos 8,40 7,26 7,24 7,50 7,00 5,29ACIDENTES COM VÍTIMAS NA CAPITAL8.0007.0006.0005.0004.000Acidentes comvítimas3.0002.0001.00002004 2005 2006 2007 2008 2009ANOSFONTE: BPTRAN - P/3 Planejamento e C.T.I. Centro de Tecnologia e InformaçõesIBGE / IPARDESNota: (1) Computadas apenas as mortes no local <strong>do</strong>s acidentes61