○ ○ ○ ○regulamentado pela Emen<strong>da</strong> Constitucional,mas é um espaço em aberto,no qual as administrações poderãoarbitrar to<strong>da</strong>s as ações e serviçospúblicos em saúde. Vale dizer, osgestores estaduais estarão decidindoentre mais contratos com prestadoresprivados, novos hospitais públicos,novas equipes de saúde <strong>da</strong> família,mais distribuição de medicamentos,ampliação dos salários dos servidores,reforço a mecanismos de capacitaçãoprofissional, dentre outros.A Tabela 4 mostra os <strong>da</strong>dos paraas capitais. Podemos dividi-las emtrês grupos. O primeiro deles,formado por Porto Alegre, Cuiabá eCampo Grande, os níveis devinculação previstos para 2004 jáforam ultrapassados em 2000. Osegundo grupo, formado por Palmas,São Luís, João Pessoa, Natal, BeloHorizonte, Vitória, Rio de Janeiro,São Paulo, Curitiba, Florianópolis eGoiânia, superou, em 2000, o piso devinculação, mas se encontra abaixodos 15% previstos como nível devinculação plena. O terceiro grupo éformado pelo restante <strong>da</strong>s capitais,que nem atingiu o piso de vinculaçãoem 2000. Vale notar que o cumprimento<strong>da</strong> Emen<strong>da</strong> resultará emrecursos adicionais de R$ 627milhões em 2004, com expansãopaulatina até aquele ano.municipais, que definirão seu peso ea abrangência.A Lei Complementar, enuncia<strong>da</strong>pela Emen<strong>da</strong> Constitucional n.º 29,desponta como locus, por excelência,dessa discussão porque vai identificara postura <strong>da</strong>s autori<strong>da</strong>des públicasfrente aos compromissos com aformação de pessoal e a gestão derecursos humanos. De todo modo,trata-se de uma grande oportuni<strong>da</strong>depara colocar a discussão de recursoshumanos ao lado dos grandes temas<strong>da</strong> saúde: financiamento, gestão emodelo de atenção.É importante entender que aEmen<strong>da</strong> Constitucional representauma grande chance para que a áreade Recursos Humanos, nota<strong>da</strong>mentenas administrações estaduais, ganheenorme espaço. Seja na gestão <strong>da</strong>Política de Pessoal, seja na construçãodo aparelho formador. A preservaçãode uma parcela dos ganhos envolvidos,para aplicação nesta área,envolve uma oportuni<strong>da</strong>de talvezúnica na história <strong>da</strong> saúde. Éimportante notar que o GovernoFederal foi à frente, implementandoo Projeto de Profissionalização dosTrabalhadores <strong>da</strong> Área de Enfermagem(PROFAE) e as capacitações equalificações em saúde <strong>da</strong> família.Mas será a condução <strong>da</strong>s PolíticasEstaduais, pactua<strong>da</strong>s com os gestoresFormação81
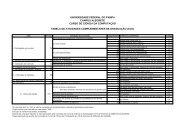
○ ○ ○ ○Tabela 1Despesa Real e Projeções segundo a Emen<strong>da</strong> n o 29 – 2000 a 2004(em R$ correntes)UFPessoal eEncargosSociaisReceitaVincula<strong>da</strong>DespesaPrópriaSimulação com mínimo% DP/RVDespesaPrópria2000Percentual Desp. Própria/Receita2001estim2002estim2003estim2004estimExpansãoRondônia 50.132.003 845.161.582 66.260.668 12,00 101.419.390 7,84 8,67 9,34 9,87 12,00 35.158.722Acre 89.799.361 532.395.712 115.849.307 21,76 115.849.307 21,76 12,00 12,00 12,00 12,00 -Amazonas 113.492.298 1.587.946.982 285.195.278 17,96 285.195.278 17,96 12,00 12,00 12,00 12,00 -Roraima 6.821.835 400.384.786 52.450.407 13,10 52.450.407 13,10 12,00 12,00 12,00 12,00 -Pará 71.239.390 2.117.292.352 157.526.551 12,00 254.075.082 7,44 8,35 9,08 9,67 12,00 96.548.531Amapá 31.587.522 952.948.147 74.044.071 12,00 114.353.778 7,77 8,62 9,29 9,83 12,00 40.309.707Tocantins 48.488.087 853.553.886 70.503.551 12,00 102.426.466 8,26 9,01 9,61 10,09 12,00 31.922.915Fonte: Balanços dos Governos Estaduais de 2000.Tabela 2Despesa Real e Projeções segundo a Emen<strong>da</strong> n o 29 – 2000 a 2004(em R$ correntes)UFPessoal eEncargosSociaisReceitaVincula<strong>da</strong>DespesaPrópriaSimulação com mínimo% DP/RVDespesaPrópria2000Percentual Desp. Própria/Receita2001estim2002estim2003estim2004estimExpansãoMaranhão 14.666.723 1.633.918.816 24.835.566 12,00 196.070.258 1,52 8,00 8,80 9,44 12,00 171.234.692Piauí 39.015.082 984.552.112 49.424.516 12,00 118.146.253 5,02 8,00 8,80 9,44 12,00 68.721.737Ceará 112.069.464 2.620.402.828 253.917.034 12,00 314.448.339 9,69 10,15 10,52 10,82 12,00 60.531.305Rio Gr Norte 107.969.672 1.252.553.764 162.080.457 12,94 162.080.457 12,94 12,00 12,00 12,00 12,00 -Paraíba 50.216.953 1.302.634.354 57.446.175 12,00 156.316.122 4,41 8,00 8,80 9,44 12,00 98.869.947Pernambuco 222.461.841 2.834.355.055 230.433.066 12,00 340.122.607 8,13 8,90 9,52 10,02 12,00 109.689.541Alagoas 56.910.932 1.663.018.594 53.216.595 12,00 199.562.231 3,20 8,00 8,80 9,44 12,00 146.345.636Sergipe 34.371.412 1.019.433.713 34.049.086 12,00 122.332.046 3,34 8,00 8,80 9,44 12,00 88.282.960Bahia 281.032.191 4.499.478.942 374.356.648 12,00 539.937.473 8,32 9,06 9,64 10,12 12,00 165.580.825Fonte: Balanços dos Governos Estaduais de 2000.82Nº 05 MAIO DE 2002
- Page 1 and 2:
05FormaçãoFormação Técnica em
- Page 3 and 4:
SumárioEditorial3Recursos Humanos
- Page 6:
○ ○ ○ ○AnálisePolítica de
- Page 9 and 10:
○ ○ ○ ○· difusão, com rel
- Page 11 and 12:
○ ○ ○ ○para fortalecimento
- Page 13 and 14:
○ ○ ○ ○A reforma educaciona
- Page 15 and 16:
○ ○ ○ ○Nos hospitais, o env
- Page 17 and 18:
○ ○ ○ ○da qualidade técnic
- Page 20 and 21:
○ ○ ○ ○O paradigma polític
- Page 22 and 23:
○ ○ ○ ○profissional, indepe
- Page 24 and 25:
○ ○ ○ ○institucional do Min
- Page 26 and 27:
○ ○ ○ ○Diante do exposto, o
- Page 28:
○ ○ ○ ○BibliografiaBRASIL.
- Page 32 and 33: ○ ○ ○ ○IntroduçãoO perío
- Page 34 and 35: ○ ○ ○ ○Considerando a regul
- Page 36 and 37: ○ ○ ○ ○palavra, os signatá
- Page 38 and 39: ○ ○ ○ ○De modo geral, esses
- Page 40 and 41: ○ ○ ○ ○nenhuma outra. Escop
- Page 42 and 43: ○ ○ ○ ○Não é o propósito
- Page 44: ○ ○ ○ ○HABERMAS, J. The The
- Page 48 and 49: ○ ○ ○ ○IntroduçãoPensar a
- Page 50 and 51: ○ ○ ○ ○- a matrícula nos 7
- Page 52 and 53: ○ ○ ○ ○Tabela 1UF/RegiãoIn
- Page 54 and 55: ○ ○ ○ ○O que faz a diferen
- Page 56 and 57: ○ ○ ○ ○de conduzir o currí
- Page 58 and 59: ○ ○ ○ ○municipais de saúde
- Page 60: ○ ○ ○ ○AnáliseFormação p
- Page 63 and 64: ○ ○ ○ ○o sujeito e a comuni
- Page 65 and 66: ○ ○ ○ ○desse espetáculo da
- Page 67 and 68: ○ ○ ○ ○Na fase I (1995/1998
- Page 69 and 70: ○ ○ ○ ○Estruturante de Exte
- Page 71 and 72: ○ ○ ○ ○buições, dos membr
- Page 73 and 74: ○ ○ ○ ○saber que todo saber
- Page 75 and 76: ○ ○ ○ ○CASTIEL, Luís David
- Page 78 and 79: ○ ○ ○ ○IntroduçãoO objeti
- Page 80 and 81: ○ ○ ○ ○ceirização de serv
- Page 84 and 85: ○ ○ ○ ○Tabela 3Despesa Real
- Page 86: ○ ○ ○ ○BibliografiaARRETCHE
- Page 90 and 91: ○ ○ ○ ○Formação - As Esco
- Page 92 and 93: ○ ○ ○ ○introduzir um curso
- Page 94: ○ ○ ○ ○Entrevista Marli Apa
- Page 97 and 98: ○ ○ ○ ○pois foram iniciadas
- Page 99 and 100: ○ ○ ○ ○nova LDB, são eles:
- Page 101: ○ ○ ○ ○“escola-função