Visualizar Tese - Instituto de Biociências - Unesp
Visualizar Tese - Instituto de Biociências - Unesp
Visualizar Tese - Instituto de Biociências - Unesp

Create successful ePaper yourself
Turn your PDF publications into a flip-book with our unique Google optimized e-Paper software.
<strong>Tese</strong> <strong>de</strong> Doutorado Hirose, G. L., 2009<br />
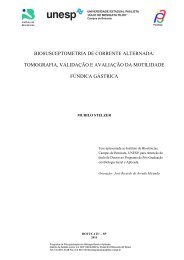
Temperatura ºC<br />
Temperatura ºC Temperatura ºC<br />
Inshore<br />
2000<br />
36<br />
34<br />
32<br />
30<br />
28<br />
26<br />
24<br />
22<br />
20<br />
18<br />
16<br />
Verão Outono Inverno Primavera<br />
36 2001<br />
34<br />
32<br />
30<br />
28<br />
26<br />
24<br />
22<br />
20<br />
18<br />
2001<br />
16<br />
Verão Outono Inverno Primavera<br />
36 2002<br />
34<br />
32<br />
30<br />
28<br />
26<br />
24<br />
22<br />
20<br />
18<br />
16<br />
Verão Outono Inverno Primavera<br />
36<br />
34<br />
32<br />
30<br />
28<br />
26<br />
24<br />
22<br />
20<br />
36<br />
34<br />
32<br />
30<br />
28<br />
26<br />
24<br />
22<br />
20<br />
36<br />
34<br />
32<br />
30<br />
28<br />
26<br />
24<br />
22<br />
20<br />
Salinida<strong>de</strong> <strong>de</strong> superfície<br />
Temperatura <strong>de</strong> superfície<br />
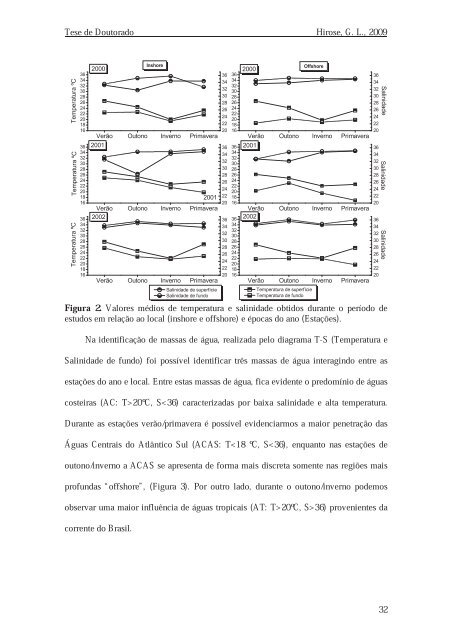
Figura 2. Valores médios <strong>de</strong> temperatura e salinida<strong>de</strong> obtidos durante o período <strong>de</strong><br />
Salinida<strong>de</strong> <strong>de</strong> fundo<br />
Temperatura <strong>de</strong> fundo<br />
36<br />
34<br />
32<br />
30<br />
28<br />
26<br />
24<br />
22<br />
20<br />
18<br />
16<br />
36<br />
34<br />
32<br />
30<br />
28<br />
26<br />
24<br />
22<br />
20<br />
18<br />
16<br />
2000<br />
Offshore<br />
Verão Outono Inverno Primavera<br />
2001<br />
36 2002<br />
34<br />
32<br />
30<br />
28<br />
26<br />
24<br />
22<br />
20<br />
18<br />
16<br />
Verão Outono Inverno Primavera<br />
Verão Outono Inverno Primavera<br />
estudos em relação ao local (inshore e offshore) e épocas do ano (Estações).<br />
Na i<strong>de</strong>ntificação <strong>de</strong> massas <strong>de</strong> água, realizada pelo diagrama T-S (Temperatura e<br />
Salinida<strong>de</strong> <strong>de</strong> fundo) foi possível i<strong>de</strong>ntificar três massas <strong>de</strong> água interagindo entre as<br />
estações do ano e local. Entre estas massas <strong>de</strong> água, fica evi<strong>de</strong>nte o predomínio <strong>de</strong> águas<br />
costeiras (AC: T>20ºC, S