Análise comparativa dos serviços públicos de ... - IEE/USP
Análise comparativa dos serviços públicos de ... - IEE/USP Análise comparativa dos serviços públicos de ... - IEE/USP
ANEXO 7 – BRASIL: DADOS SOCIOECONÔMICOS 1992 - 2001 437 25,0 (%) Até 1 > 1 a 2 > 2 a 3 > 3 a 5 > 5 a 10 > 20 > 10 a 20 S/rend (3) 20,0 15,0 10,0 5,0 0,0 1992 1993 1995 1996 1997 1998 1999 2001 Figura A.7.1 – Famílias moradoras em domicílios particulares por classe de rendimentos - percentuais – Brasil – TOTAL – 1992 a 2001. Fonte: IBGE, 2002b, Pesquisa Nacional por Amostra de Domicílios, vários anos. (3) Inclusive as famílias cujos componentes receberam somente em benefícios. 25,0 20,0 (%) Até 1 > 1 a 2 > 2 a 3 > 3 a 5 > 5 a 10 > 10 a 20 > 20 S/rend (3) S/declr 15,0 10,0 5,0 0,0 1992 1993 1995 1996 1997 1998 1999 2001 Figura A.7.2 – Famílias moradoras em domicílios particulares por classe de rendimentos - percentuais – Brasil – URBANA – 1992 a 2001. Fonte: IBGE, 2002b, Pesquisa Nacional por Amostra de Domicílios, vários anos. (3) Inclusive as famílias cujos componentes receberam somente em benefícios.
ANEXO 7 – BRASIL: DADOS SOCIOECONÔMICOS 1992 - 2001 438 35,0 30,0 (%) Até 1 > 1 a 2 > 2 a 3 > 3 a 5 > 5 a 10 > 10 a 20 > 20 S/rend (3) S/declr 25,0 20,0 15,0 10,0 5,0 0,0 1992 1993 1995 1996 1997 1998 1999 2001 Figura A.7.3 - Famílias moradoras em domicílios particulares por classe de rendimentos - percentuais – Brasil – RURAL – 1992 a 2001. Fonte: IBGE, 2002b, Pesquisa Nacional por Amostra de Domicílios, vários anos. (3) Inclusive as famílias cujos componentes receberam somente em benefícios. Tabela A.7.1 - Rendimento médio mensal nominal das pessoas de 10 anos ou mais de idade – Brasil e regiões – 1989 a 2001 Brasil Norte Nordeste Sudeste Sul Centro-Oeste Urbana 1989 (NCz$) 594 616 304 753 603 668 1990 (Cr$) 15 978 17 652 8 446 19 846 16 452 18 589 1992 (Cr$) 820 402 683 768 449 647 1 018 998 939 884 844 593 1993 (CR$) 17 847 15 851 9 896 21 649 21 008 19 500 1995 (R$) 255 224 138 319 287 249 1996 (R$) 290 235 158 366 325 290 1997 (R$) 303 247 164 382 335 319 1998 (R$) 314 246 176 391 349 334 1999 (R$) 313 248 177 386 358 326 2001(R$) 365 285 204 452 420 404 Fonte: IBGE, 2002d. Nota: exclusive o rendimento da população da área rural de Rondônia, Acre, Amazonas, Roraima, Pará e Amapá
- Page 402 and 403: 395 COUTINHO, D.R. A universalizaç
- Page 404 and 405: 397 ______. Bibliografia Sobre Biog
- Page 406 and 407: 399 FIUZA, E.P.S.; NERI M.C. Reflex
- Page 408 and 409: 401 HISTÓRIA do pensamento econôm
- Page 410 and 411: 403 tese/tabela.shtm>. Acesso em: 0
- Page 412 and 413: 405 LIMA, M. Petróleo, energia el
- Page 414 and 415: 407 MORAES, L.R.S. Política nacion
- Page 416 and 417: 409 Natural (CENARIOS), Universidad
- Page 418 and 419: 411 REZENDE, S.C.; HELLER, L. O san
- Page 420 and 421: 413 ______. Análise de viabilidade
- Page 422 and 423: 415 SOUZA, M.M. O processo de forma
- Page 424 and 425: ANEXO 1 - MONOPÓLIO FORTE, MONOPÓ
- Page 426 and 427: ANEXO 2 - INDICADORES: CARACTERÍST
- Page 428 and 429: ANEXO 3 - EMPRESAS ELÉTRICAS: DÉC
- Page 430 and 431: ANEXO 4 - ESTATÍSTICAS DE SANEAMEN
- Page 432 and 433: ANEXO 4 - ESTATÍSTICAS DE SANEAMEN
- Page 434 and 435: ANEXO 5 - PNSB 1974: DADOS SELECION
- Page 437 and 438: Tabela A.5.1 - Número total de cid
- Page 439 and 440: E 14 1.826.546 479.135 26,2 5 271.2
- Page 441 and 442: ANEXO 6 - DADOS DAS PRIVATIZAÇÕES
- Page 443 and 444: ANEXO 6 - DADOS DAS PRIVATIZAÇÕES
- Page 445 and 446: ANEXO 6 - DADOS DAS PRIVATIZAÇÕES
- Page 447 and 448: ANEXO 6 - DADOS DAS PRIVATIZAÇÕES
- Page 449 and 450: Município População Atendida 1 A
- Page 451: Mato Grosso 1 Nobres 12.600 Empresa
- Page 455 and 456: ANEXO 7 - BRASIL: DADOS SOCIOECONÔ
- Page 457 and 458: ANEXO 8 - IDH BRASIL: DADOS SELECIO
- Page 459 and 460: ANEXO 8 - IDH BRASIL: DADOS SELECIO
- Page 461 and 462: ANEXO 8 - IDH BRASIL: DADOS SELECIO
- Page 463 and 464: 84 85 86 87 88 89 90 91 92 93 94 95
- Page 465 and 466: ANEXO 9 - PERFIL DO DÉFICIT DE SER
- Page 467 and 468: ANEXO 9 - PERFIL DO DÉFICIT DE SER
- Page 469 and 470: ANEXO 9 - PERFIL DO DÉFICIT DE SER
- Page 471 and 472: ANEXO 9 - PERFIL DO DÉFICIT DE SER
- Page 473 and 474: ANEXO 9 - PERFIL DO DÉFICIT DE SER
- Page 475 and 476: ANEXO 9 - PERFIL DO DÉFICIT DE SER
- Page 477 and 478: ANEXO 9 - PERFIL DO DÉFICIT DE SER
- Page 479 and 480: ANEXO 9 - PERFIL DO DÉFICIT DE SER
- Page 481 and 482: ANEXO 9 - PERFIL DO DÉFICIT DE SER
- Page 483 and 484: ANEXO 9 - PERFIL DO DÉFICIT DE SER
- Page 485 and 486: ANEXO 10 - PREMISSAS WDR 1994 (BM)
- Page 487 and 488: ANEXO 10 - PREMISSAS WDR 1994 (BM)
- Page 489 and 490: ANEXO 10 - PREMISSAS WDR 1994 (BM)
- Page 491 and 492: ANEXO 10 - PREMISSAS WDR 1994 (BM)
- Page 493 and 494: ANEXO 10 - PREMISSAS WDR 1994 (BM)
- Page 495 and 496: ANEXO 10 - PREMISSAS WDR 1994 (BM)
- Page 497 and 498: ANEXO 10 - PREMISSAS WDR 1994 (BM)
- Page 499 and 500: ANEXO 10 - PREMISSAS WDR 1994 (BM)
- Page 501 and 502: ANEXO 10 - PREMISSAS WDR 1994 (BM)
ANEXO 7 – BRASIL: DADOS SOCIOECONÔMICOS 1992 -<br />
2001<br />
437<br />
25,0<br />
(%)<br />
Até 1 > 1 a 2 > 2 a 3 > 3 a 5<br />
> 5 a 10 > 20 > 10 a 20 S/rend (3)<br />
20,0<br />
15,0<br />
10,0<br />
5,0<br />
0,0<br />
1992 1993 1995 1996 1997 1998 1999 2001<br />
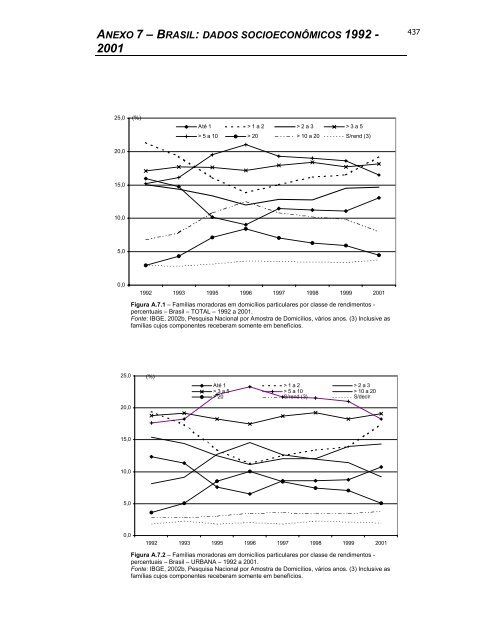
Figura A.7.1 – Famílias moradoras em domicílios particulares por classe <strong>de</strong> rendimentos -<br />
percentuais – Brasil – TOTAL – 1992 a 2001.<br />
Fonte: IBGE, 2002b, Pesquisa Nacional por Amostra <strong>de</strong> Domicílios, vários anos. (3) Inclusive as<br />
famílias cujos componentes receberam somente em benefícios.<br />
25,0<br />
20,0<br />
(%)<br />
Até 1 > 1 a 2 > 2 a 3<br />
> 3 a 5 > 5 a 10 > 10 a 20<br />
> 20 S/rend (3) S/<strong>de</strong>clr<br />
15,0<br />
10,0<br />
5,0<br />
0,0<br />
1992 1993 1995 1996 1997 1998 1999 2001<br />
Figura A.7.2 – Famílias moradoras em domicílios particulares por classe <strong>de</strong> rendimentos -<br />
percentuais – Brasil – URBANA – 1992 a 2001.<br />
Fonte: IBGE, 2002b, Pesquisa Nacional por Amostra <strong>de</strong> Domicílios, vários anos. (3) Inclusive as<br />
famílias cujos componentes receberam somente em benefícios.


