- Page 1:
UNIVERSIDADE DE SÃO PAULO Programa
- Page 4 and 5:
MERCEDES, SONIA SEGER PEREIRA Anál
- Page 6 and 7:
ABSTRACT The objective of this thes
- Page 8 and 9:
2.5. Conclusões 71 3. Evolução,
- Page 10 and 11:
4.1. A regionalização da pobreza
- Page 12 and 13:
2 1.1. Motivação Embora venha sen
- Page 14 and 15:
4 vigentes no país, considerando a
- Page 16 and 17:
6 integradas, de abrangência nacio
- Page 18 and 19:
8 A caracterização dos setores, n
- Page 20 and 21:
10 1. Apresentação 1.1. Motivaç
- Page 22 and 23:
12 privilegiou-se o setor de saneam
- Page 24 and 25:
14 causadas pelo atual padrão de c
- Page 26 and 27:
16 periféricos na formulação de
- Page 28 and 29:
18 Os Primeiros pensadores econômi
- Page 30 and 31:
20 O Liberalismo Clássico constitu
- Page 32 and 33:
22 tais como macroeconomia, moeda,
- Page 34 and 35:
24 Desenvolvimento, as teorias da I
- Page 36 and 37:
26 BIRD (Banco Internacional de Rec
- Page 38 and 39:
28 do mercado reafirmou-se, indiscu
- Page 40 and 41:
30 2.3. REGULAÇÃO ECONÔMICA E IM
- Page 42 and 43:
32 “competição onde possível (
- Page 44 and 45:
34 2.3.1. MONOPÓLIO NATURAL, INDÚ
- Page 46 and 47:
36 desse fluxo. Algumas redes atuam
- Page 48 and 49:
38 pela menor tarifa, ou uma combin
- Page 50 and 51:
40 para investimentos e repasse de
- Page 52 and 53:
42 baixa renda do acesso ao serviç
- Page 54 and 55:
44 2.4. DESENVOLVIMENTO, DESAFIOS S
- Page 56 and 57:
46 Ainda outra corrente privilegiav
- Page 58 and 59:
48 vida dignos e incorpora a exigê
- Page 60 and 61:
50 bem estar 33 . Assim, a combina
- Page 62 and 63:
52 comunidades pobres e/ou isoladas
- Page 64 and 65:
54 generalização do transporte a
- Page 66 and 67:
56 problemas supramencionados. Assi
- Page 68 and 69:
58 à poluição exerceram profunda
- Page 70 and 71:
60 Dessa forma, acredita-se que a s
- Page 72 and 73:
62 Plano Real já seriam uma polít
- Page 74 and 75:
64 programas de reestruturação bu
- Page 76 and 77:
66 O modelo de reestruturação apl
- Page 78 and 79:
68 do estágio de implementação d
- Page 80 and 81:
70 por fim, desqualificação do ó
- Page 82 and 83:
72 do um imaginário coletivo no qu
- Page 84 and 85:
75 3. EVOLUÇÃO, PERFIL E PROVISÃ
- Page 86 and 87:
77 do regime militar, e das necessi
- Page 88 and 89:
79 informações é regional, no â
- Page 90 and 91:
81 urbanização na Europa e nos Es
- Page 92 and 93:
83 nesse processo 5 . De qualquer f
- Page 94 and 95:
85 provisoriedade” 6 do modo de v
- Page 96 and 97:
87 demanda residencial não era tã
- Page 98 and 99:
89 Nesse contexto, a retomada de re
- Page 100 and 101:
91 se um processo paulatino de cent
- Page 102 and 103:
93 A Constituição de 1891, republ
- Page 104 and 105:
95 gerais de higiene e assistência
- Page 106 and 107:
97 contratos de concessão regiam t
- Page 108 and 109:
99 Quanto aos serviços de saneamen
- Page 110 and 111:
101 (tabela 3.9). Segundo dados do
- Page 112 and 113:
103 ampliar as captações e constr
- Page 114 and 115:
105 (Branco, 1975). As primeiras hi
- Page 116 and 117:
107 1931 Proposição, por Henrique
- Page 118 and 119:
109 Segundo Lima (1995), até 1940
- Page 120 and 121:
111 Nos períodos mais prósperos d
- Page 122 and 123:
113 constituição do setor de ener
- Page 124 and 125:
115 abastecimento de Henrique e Sat
- Page 126 and 127:
117 controle dos serviços de energ
- Page 128 and 129:
119 desvalorização cambial), resu
- Page 130 and 131:
121 elétrica e transportes, para d
- Page 132 and 133:
123 Rezende, 2000; Silva, 1998; Lim
- Page 134 and 135:
125 Ressurgência 1953 4,7 8,7 0,2
- Page 136 and 137:
127 Tabela 3.23 - Distribuição (%
- Page 138 and 139:
129 Tabela 3.30 - Distritos por tip
- Page 140 and 141:
131 ainda que com ‘vários matize
- Page 142 and 143:
133 abastecimento de água e esgota
- Page 144 and 145:
135 c) além da idéia subjacente
- Page 146 and 147:
137 Presidência da República Mini
- Page 148 and 149:
139 Nos anos do primeiro governo de
- Page 150 and 151:
141 como forma de “enfrentar” o
- Page 152 and 153:
143 proprietários. Outra vitória
- Page 154 and 155:
145 Francisco, ainda com o auxílio
- Page 156 and 157:
147 poder concedente e à prestaç
- Page 158 and 159:
149 esgotamento sanitário. O geren
- Page 160 and 161:
151 expansão dos setores foi const
- Page 162 and 163:
153 Geisel (1974 - 79) I PND - Plan
- Page 164 and 165:
155 Tal se nota, por exemplo, já d
- Page 166 and 167:
157 A infra-estrutura social, sobre
- Page 168 and 169:
159 ruptura, brusca, em certa medid
- Page 170 and 171:
161 Figura 3.8 - Evolução do cons
- Page 172 and 173:
163 M. Gerais 402 320 44,4 24 596 1
- Page 174 and 175:
165 3.3.3.3. EVOLUÇÃO TECNOLÓGIC
- Page 176 and 177: 167 Com a interligação efetiva do
- Page 178 and 179: 169 modelo de gestão cada vez mais
- Page 180 and 181: 171 1995, Branco, 1975). No setor d
- Page 182 and 183: 173 passou ao DNAE. O Decreto 62.72
- Page 184 and 185: 175 Eletrobrás passaram a refletir
- Page 186 and 187: 177 efetuados anualmente, a partir
- Page 188 and 189: 179 1976 405,96 8,6 1977 402,73 9,0
- Page 190 and 191: 181
- Page 192 and 193: 183 Tabela 3.48 - Uso de recursos -
- Page 194 and 195: 185 Tabela 3.49 - Uso de recursos -
- Page 196 and 197: 187 Ano Total de recursos* Recursos
- Page 198 and 199: 189 substituição gradual dos repa
- Page 200 and 201: 191 sanitário. 3.3.5. CONDIÇÕES
- Page 202 and 203: 193 sendo realizados. A tecnologia
- Page 204 and 205: 195 no planejamento e financiamento
- Page 206 and 207: 197 A partir de 1983, os países cr
- Page 208 and 209: 199 sociais no seio dos países. Ma
- Page 210 and 211: 201 O esgotamento do regime militar
- Page 212 and 213: 203 1995). Este conjunto de fatores
- Page 214 and 215: 205 prosseguimento do total alinham
- Page 216 and 217: 207 Nos governos Sarney e Collor, a
- Page 218 and 219: 209 numa balança comercial e num b
- Page 220 and 221: 211 investimentos em infra-estrutur
- Page 222 and 223: 213 3 2,5 2 1,5 1 0,5 0 -0,5 jan/98
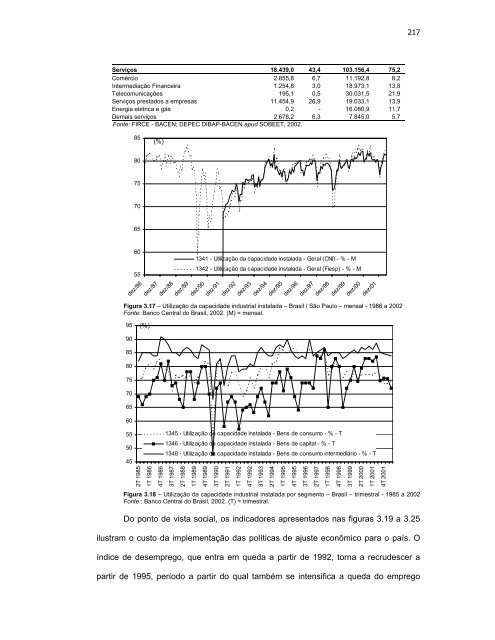
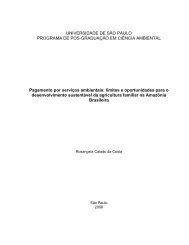
- Page 224 and 225: 215 A utilização da capacidade in
- Page 228 and 229: 219 190 170 150 130 110 90 70 50 ja
- Page 230 and 231: 221 estar efetivamente minimiza qua
- Page 232 and 233: 223 indicadores, inclusive critéri
- Page 234 and 235: 225 permanece alta. A análise da d
- Page 236 and 237: 227 Fonte: PNUD, 2002. Figura 3.29
- Page 238 and 239: 229 econômica, maior renda, e cuja
- Page 240 and 241: 231 todos, expressa por uma taxa ne
- Page 242 and 243: 233 De acordo com as figuras 3.36 e
- Page 244 and 245: 235 As figuras A.9.8 a A.9.13 detal
- Page 246 and 247: 237 Figura 3.38 - Variação anual
- Page 248 and 249: 239 venda dos eletrodomésticos. Os
- Page 250 and 251: 241 como será considerada a necess
- Page 252 and 253: 243 Figura 3.40 - Área das bacias
- Page 254 and 255: 245 Total de municípios Município
- Page 256 and 257: 247 80 (%) 70 60 50 40 água - c/ca
- Page 258 and 259: 249 percentuais significativos (cer
- Page 260 and 261: 251 Enterrado 224.296 22.039 59.697
- Page 262 and 263: 253 desses serviços, de forma que
- Page 264 and 265: 255 foi disseminada através de ins
- Page 266 and 267: 257 4. Moedas e financiamento das p
- Page 268 and 269: 259 Ministério das Minas e Energia
- Page 270 and 271: 261 Boletim de Política Industrial
- Page 272 and 273: 263 institucional do setor elétric
- Page 274 and 275: 265 energia e o MME 54 . Também o
- Page 276 and 277:
267 Privatização Serviço origem
- Page 278 and 279:
269 Ainda em novembro de 1986, o BN
- Page 280 and 281:
271 A Resolução 09/90, do CCFGTS,
- Page 282 and 283:
273 gestão dos serviços, incluír
- Page 284 and 285:
275 de créditos à existência de
- Page 286 and 287:
277 respectivamente com o BNDES e c
- Page 288 and 289:
279 Com a rejeição do projeto de
- Page 290 and 291:
281 entidades (como o SUS); permite
- Page 292 and 293:
283 Ceará, Rio de Janeiro, Espíri
- Page 294 and 295:
285 coleta de esgotos, tal como já
- Page 296 and 297:
287 de caráter da gestão do setor
- Page 298 and 299:
Figura 3.46 - Fluxograma das etapas
- Page 300 and 301:
291 país o regime de preços-teto.
- Page 302 and 303:
293 Tabela 3.94 - Efeito do corte n
- Page 304 and 305:
295 220 200 180 R$/MWh Norte Nordes
- Page 306 and 307:
297 Até 2 > 2 a 3 > 3 a 5 > 5 a 6
- Page 308 and 309:
299 residencial) para os novos cont
- Page 310 and 311:
301 inferiores a 12 meses. A revis
- Page 312 and 313:
303 Para o autor: Na prática, a qu
- Page 314 and 315:
305 justificativas técnicas que oc
- Page 316 and 317:
307 sob forte restrição, e apesar
- Page 318 and 319:
309 Pessoal e Encargos Sociais 37.8
- Page 320 and 321:
311 por completo a sistemática, co
- Page 322 and 323:
313 Concessões Privadas para Prest
- Page 324 and 325:
315 1991 0,16 0,13 1992 0,12 0,09 1
- Page 326 and 327:
317 recursos (Montenegro, 2000; ___
- Page 328 and 329:
319 CS = DEX + DPA + i (IR), onde:
- Page 330 and 331:
321 correspondência havia entre aq
- Page 332 and 333:
323 Tabela 3.114 - Evolução da ta
- Page 334 and 335:
325 300 250 1980 = base 100 200 150
- Page 336 and 337:
327 POTENCIAL HIDROELÉTRICO DISPON
- Page 338 and 339:
329 privada/pública BRASIL Quant.
- Page 340 and 341:
331 apresentado, como peça de publ
- Page 342 and 343:
333 fatais. Segundo sua análise, e
- Page 344 and 345:
335 Figura 3.58 - Ranking das empre
- Page 346 and 347:
337 Figura 3.62 - Ranking das empre
- Page 348 and 349:
339 nesse tópico, a Sabesp (cujo p
- Page 350 and 351:
341 Saneago 2937 620209 578466 7997
- Page 352 and 353:
343 Hab Total Residen. Coletado 100
- Page 354 and 355:
345 com um máximo de 64,6% (CAER)
- Page 356 and 357:
347 econômico-financeiros e técni
- Page 358 and 359:
349 As agências regulatórias têm
- Page 360 and 361:
351 Faz-se uma ressalva, entretanto
- Page 362 and 363:
353 Apesar das metas ambiciosas e d
- Page 364 and 365:
355 uma geração de empregos diret
- Page 366 and 367:
357 sobre os sistemas de suprimento
- Page 368 and 369:
359 .... Malária por Plasmodium vi
- Page 370 and 371:
361 detinha maciçamente as concess
- Page 372 and 373:
363 A importância da opção desen
- Page 374 and 375:
365 PL 4.147 nenhum empecilho de mo
- Page 376 and 377:
369 4. DISCUSSÃO FINAL E CONCLUSÕ
- Page 378 and 379:
371 mais as atividades econômicas
- Page 380 and 381:
373 no país, como também a relaç
- Page 382 and 383:
375 posteriormente, a pressão do g
- Page 384 and 385:
377 momento), imputou-se ao setor d
- Page 386 and 387:
379 4.4. REESTRUTURAÇÃO LIBERAL E
- Page 388 and 389:
381 liberalização apresentada na
- Page 390 and 391:
383 Sobre esses princípios ele tem
- Page 392 and 393:
385 sobretudo a mais carente, e abr
- Page 394 and 395:
387 AGÊNCIA NACIONAL DE VIGILÂNCI
- Page 396 and 397:
389 BANCO MUNDIAL. Relatório sobre
- Page 398 and 399:
391 BRANCO, Z.M. Vida e luta de Cat
- Page 400 and 401:
393 . Acesso em:06 de novembro de 2
- Page 402 and 403:
395 COUTINHO, D.R. A universalizaç
- Page 404 and 405:
397 ______. Bibliografia Sobre Biog
- Page 406 and 407:
399 FIUZA, E.P.S.; NERI M.C. Reflex
- Page 408 and 409:
401 HISTÓRIA do pensamento econôm
- Page 410 and 411:
403 tese/tabela.shtm>. Acesso em: 0
- Page 412 and 413:
405 LIMA, M. Petróleo, energia el
- Page 414 and 415:
407 MORAES, L.R.S. Política nacion
- Page 416 and 417:
409 Natural (CENARIOS), Universidad
- Page 418 and 419:
411 REZENDE, S.C.; HELLER, L. O san
- Page 420 and 421:
413 ______. Análise de viabilidade
- Page 422 and 423:
415 SOUZA, M.M. O processo de forma
- Page 424 and 425:
ANEXO 1 - MONOPÓLIO FORTE, MONOPÓ
- Page 426 and 427:
ANEXO 2 - INDICADORES: CARACTERÍST
- Page 428 and 429:
ANEXO 3 - EMPRESAS ELÉTRICAS: DÉC
- Page 430 and 431:
ANEXO 4 - ESTATÍSTICAS DE SANEAMEN
- Page 432 and 433:
ANEXO 4 - ESTATÍSTICAS DE SANEAMEN
- Page 434 and 435:
ANEXO 5 - PNSB 1974: DADOS SELECION
- Page 437 and 438:
Tabela A.5.1 - Número total de cid
- Page 439 and 440:
E 14 1.826.546 479.135 26,2 5 271.2
- Page 441 and 442:
ANEXO 6 - DADOS DAS PRIVATIZAÇÕES
- Page 443 and 444:
ANEXO 6 - DADOS DAS PRIVATIZAÇÕES
- Page 445 and 446:
ANEXO 6 - DADOS DAS PRIVATIZAÇÕES
- Page 447 and 448:
ANEXO 6 - DADOS DAS PRIVATIZAÇÕES
- Page 449 and 450:
Município População Atendida 1 A
- Page 451 and 452:
Mato Grosso 1 Nobres 12.600 Empresa
- Page 453 and 454:
ANEXO 7 - BRASIL: DADOS SOCIOECONÔ
- Page 455 and 456:
ANEXO 7 - BRASIL: DADOS SOCIOECONÔ
- Page 457 and 458:
ANEXO 8 - IDH BRASIL: DADOS SELECIO
- Page 459 and 460:
ANEXO 8 - IDH BRASIL: DADOS SELECIO
- Page 461 and 462:
ANEXO 8 - IDH BRASIL: DADOS SELECIO
- Page 463 and 464:
84 85 86 87 88 89 90 91 92 93 94 95
- Page 465 and 466:
ANEXO 9 - PERFIL DO DÉFICIT DE SER
- Page 467 and 468:
ANEXO 9 - PERFIL DO DÉFICIT DE SER
- Page 469 and 470:
ANEXO 9 - PERFIL DO DÉFICIT DE SER
- Page 471 and 472:
ANEXO 9 - PERFIL DO DÉFICIT DE SER
- Page 473 and 474:
ANEXO 9 - PERFIL DO DÉFICIT DE SER
- Page 475 and 476:
ANEXO 9 - PERFIL DO DÉFICIT DE SER
- Page 477 and 478:
ANEXO 9 - PERFIL DO DÉFICIT DE SER
- Page 479 and 480:
ANEXO 9 - PERFIL DO DÉFICIT DE SER
- Page 481 and 482:
ANEXO 9 - PERFIL DO DÉFICIT DE SER
- Page 483 and 484:
ANEXO 9 - PERFIL DO DÉFICIT DE SER
- Page 485 and 486:
ANEXO 10 - PREMISSAS WDR 1994 (BM)
- Page 487 and 488:
ANEXO 10 - PREMISSAS WDR 1994 (BM)
- Page 489 and 490:
ANEXO 10 - PREMISSAS WDR 1994 (BM)
- Page 491 and 492:
ANEXO 10 - PREMISSAS WDR 1994 (BM)
- Page 493 and 494:
ANEXO 10 - PREMISSAS WDR 1994 (BM)
- Page 495 and 496:
ANEXO 10 - PREMISSAS WDR 1994 (BM)
- Page 497 and 498:
ANEXO 10 - PREMISSAS WDR 1994 (BM)
- Page 499 and 500:
ANEXO 10 - PREMISSAS WDR 1994 (BM)
- Page 501 and 502:
ANEXO 10 - PREMISSAS WDR 1994 (BM)
- Page 503 and 504:
ANEXO 10 - PREMISSAS WDR 1994 (BM)
- Page 505:
ANEXO 10 - PREMISSAS WDR 1994 (BM)