na faixa granulométrica relativa a agregados miúdos (4,8 mm). Os corpos-<strong>de</strong>-prova foram ensaiados à compressão com 7 dias <strong>de</strong> ida<strong>de</strong>, resultando numa RC 7d média <strong>de</strong> 20,56 MPa, <strong>de</strong>svio padrão <strong>de</strong> 1,76 MPa e coeficiente <strong>de</strong> variação <strong>de</strong> 8,58%. Com esses valores, <strong>de</strong>terminou-se que a amostra mínima po<strong>de</strong>ria ser <strong>de</strong> até 3,0 CP, porém adotou- se, um valor mínimo <strong>de</strong> 4,0 CP. Na Tabela 4.9 apresentam-se as características físicas dos compósitos produzidos com o resíduo <strong>de</strong> Pinus spp, com granulometrias <strong>de</strong> Dmáx = 2,4 mm e 4,8 mm. A apresentação procura comparar as características <strong>de</strong> cada compósito, <strong>em</strong> função do teor <strong>de</strong> CaCl2.2H2O utilizado. TABELA 4.9 - INFLUÊNCIA DO TEOR DE CACL2.2H2O EM COMPÓSITOS COM RESÍDUO DE PINUS spp COM DMÁX = 2,4 mm E 4,8 mm – CARACTERÍSTICAS FÍSICAS DO COMPÓSITO D Máx Partícula (mm) e Massa Específica CV Índice <strong>de</strong> Vazios CV Absorção CV Teor <strong>de</strong> CaCl2 (%) ( kg/m (%) (%) (%) (%) (%) B 0,45 A 1,15 A 3 ) Mad 2,4 mm + 0,0% CaCl2 1.437,53 38,56 26,82 1,36 Mad 4,8 mm + 0,0% CaCl 2 Mad 2,4 mm + 2,0% CaCl 2 Mad 4,8 mm + 2,0% C aCl 2 Mad 2,4 mm + 4,0% CaCl2 Mad 4,8 mm + 4,0% CaCl 2 Mad 2,4 mm + 6,0% CaCl2 Mad 4,8 mm + 6,0% CaCl 2 Mad 2,4 mm + 8,0% CaCl 2 Mad 4,8 mm + 8,0% CaCl2 A A A 1.471,10 0,62 38,98 0,74 26,50 0,79 B A A 1.488,17 1,09 35,57 3,47 23,91 2,86 A B B 1.526,92 0,85 30,92 1,08 20,25 1,10 B A A 1.491,19 0,68 38,38 0,94 25,74 A B B 1.538,13 0,52 35,62 0,99 23,16 1,46 A A A 1.560,68 1,00 34,88 2,24 22,35 1,60 B A A 1.526,65 0,64 34,38 1,43 22,52 1,80 A B B 1.564,15 0,16 35,76 3,23 22,86 B A A 1.479,38 1,23 41,86 2,11 28,31 Letras diferentes <strong>de</strong>notam diferenças estatísticas entre as médias nas colunas ao nível <strong>de</strong> 95% <strong>de</strong> confiança; Médias obtidas <strong>de</strong> 4 repetições; CV = Coeficiente <strong>de</strong> Variação; CaCl 2 = Aditivo acelerador <strong>de</strong> pega (Cloreto <strong>de</strong> Cálcio Bi-Hidratado) Analisando os valores apresentados, verifica-se: • As massas específicas dos compósitos produzidos com granulometrias confiança, para todos os teores <strong>de</strong> CaCl2.2H2O utilizados; 1,49 3,25 3,30 129 diferentes, apresentam diferenças estatisticamente significativas a 95% <strong>de</strong> • Quanto ao índice <strong>de</strong> vazios (porosida<strong>de</strong>) e absorção <strong>de</strong> água, não <strong>de</strong> verificaram diferenças significativas entre os compósitos produzidos s<strong>em</strong>
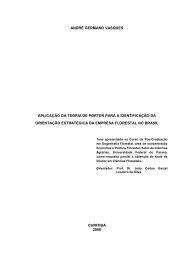
Na 130 adição <strong>de</strong> CaCl2.2H2O e com adição <strong>de</strong> 6,0% <strong>de</strong> CaCl2.2H2O , apresentando diferenças significativas para os d<strong>em</strong>ais. Figura 4.5, as características físicas dos compósitos, <strong>em</strong> função da granulometria do resíduo <strong>de</strong> Pinus spp e do teor <strong>de</strong> CaCl2.2H2O utilizados, são apresentados <strong>em</strong> gráficos <strong>de</strong> barras. Massa Específica (kg/m3) 3.000,00 2.000,00 1.000,00 0,00 1.437,53 1.471,10 1.488,17 1.526,92 1.491,19 0,0% 2,0% 4,0% 6,0% 8,0% 1.538,13 Teor <strong>de</strong> CaCl2 1.560,68 1.526,65 1.564,15 1.479,38 ( %) Índice <strong>de</strong> Vazios 60,0% 40,0% 20,0% 0,0% 38,56% 38,98% 35,57% 30,92% 38, 38% 35,62% 34, 88% 34,38% 35, 76% 41,86% 0,0% 2,0% 4,0% 6,0% 8,0% Teor <strong>de</strong> CaCl2 Ma<strong>de</strong>ira 2,4mm Ma<strong>de</strong>ira 4,8mm Ma<strong>de</strong>ira 2,4mm Ma<strong>de</strong>ira 4,8mm Absorção (%) 40,0% 30,0% 20,0% 10,0% 0,0% 26,82% 26,50% 23, 91% 20,25% 25,74% 23, 16% 22, 35% 22, 52% 22, 86% 0,0% 2,0% 4,0% 6,0% 8,0% Teor <strong>de</strong> CaCl2 MA<strong>de</strong>ira 2,4mm Ma<strong>de</strong>ira 4,8mm FIGURA 4.5 - INFLUÊNCIA DA DMÁX DO RESÍDUO DE PINUS spp E DO TEOR DE CACL2 – CARACTERÍSTICAS FÍSICAS DO COMPÓSITO 28,31%
- Page 1:
ADAUTO JOSÉ MIRANDA DE LIMA UTILIZ
- Page 4 and 5:
AGRADECIMENTOS A todos que, direta
- Page 6 and 7:
SUMÁRIO LISTA DE FIGURAS..........
- Page 8 and 9:
4 APRESENTAÇÃO E ANÁLISE DOS RES
- Page 10 and 11:
LISTA DE FIGURAS FIGURA 2.1 FORMAÇ
- Page 12 and 13:
FIGURA 4.20 RESÍDUO DE PINUS spp C
- Page 14 and 15:
LISTA DE TABELAS TABELA 2.1 COMPOSI
- Page 16 and 17:
TABELA 4.37 SUBSTITUIÇÃO DO CIMEN
- Page 18 and 19:
LISTA DE SIGLAS ABCERAM Associaçã
- Page 20 and 21:
RESUMO A crescente preocupação co
- Page 22 and 23:
1 INTRODUÇÃO A utilização inten
- Page 24 and 25:
alternativos, quais sejam: sílica
- Page 26 and 27:
2 REVISÃO DA LITERATURA Este Capí
- Page 28 and 29:
O interesse está na busca de mater
- Page 30 and 31:
Excelente estabilidade dimensional
- Page 32 and 33:
vários minerais produzidos em rea
- Page 34 and 35:
Tipos de Cimento De acordo com a AB
- Page 36 and 37:
produtores mundiais são pela ordem
- Page 38 and 39:
Sob esta ótica, a geração de res
- Page 40 and 41:
diversas unidades de açúcar, como
- Page 42 and 43:
2.3.2 Processos e Mecanismos da lig
- Page 44 and 45:
2.3.4 Métodos de Avaliação da Ma
- Page 46 and 47:
observados nos trabalhos de BERALDO
- Page 48 and 49:
2.3.5 Fatores que Afetam a Interaç
- Page 50 and 51:
• Extração com soluções alcal
- Page 52 and 53:
TABELA 2.6 - EXIGÊNCIAS FÍSICAS P
- Page 54 and 55:
simplesmente depositados à beira d
- Page 56 and 57:
Este rejeito industrial recebeu ini
- Page 58 and 59:
Quanto à quantidade de sílica ati
- Page 60 and 61:
Em função da potencialidade de em
- Page 62 and 63:
Do ponto de vista físico, AÏTCIN
- Page 64 and 65:
O cultivo de arroz ocupa o 2º luga
- Page 66 and 67:
Características Químicas e Físic
- Page 68 and 69:
TABELA 2.7 - CARACTERÍSTICAS QUIMI
- Page 70 and 71:
qualquer alteração traduz-se em d
- Page 72 and 73:
TABEL A 2 .8 - COMPOSIÇÃO TÍPICA
- Page 74 and 75:
Além da influência em relação
- Page 76 and 77:
FIGURA 2.11 - ESTRUTURAS E MECANISM
- Page 78 and 79:
Sódio (Na2SiO3) e Cloreto de Cálc
- Page 80 and 81:
2.6.1 Histórico norma brasileira N
- Page 82 and 83:
• A obra, caso utilize blocos par
- Page 84 and 85:
adota-se um método empírico de pr
- Page 86 and 87:
alteração nessas condições pode
- Page 88 and 89:
Tabela 2.10. A tolerância permitid
- Page 90 and 91:
3 MATERIAIS E MÉTODOS serão apres
- Page 92 and 93:
TABELA 3.3 - CARACTERÍSTICAS FÍSI
- Page 94 and 95:
TABELA 3.5 - CARACTERÍSTICAS DO AD
- Page 96 and 97:
- Tipo de pré-tratamento do resíd
- Page 98 and 99:
• Determinação da massa especí
- Page 100 and 101: A confecção dos corpos-de-prova c
- Page 102 and 103: 3.3.6 Determinação da Consistênc
- Page 104 and 105: endurecido. Os ensaios foram efetua
- Page 106 and 107: A determinação da resistência à
- Page 108 and 109: Número de corpos-de-prova e caract
- Page 110 and 111: internacional (malha 40 ASTM) e ret
- Page 112 and 113: • Referência 2 - Compósito prod
- Page 114 and 115: 3.4.5 Número de corpos-de-prova e
- Page 116 and 117: Cura Inicial e Final Definição da
- Page 118 and 119: Diante de tal análise de produçã
- Page 120 and 121: Portland) nos corpos-de-prova, que
- Page 122 and 123: Variáveis da 4 a Definição das F
- Page 124 and 125: 3.6.3 FIGURA 3.16 - SISTEMA ALTERNA
- Page 126 and 127: Após o período de cura inicial, o
- Page 128 and 129: 3.7.1 Características Analisadas e
- Page 130 and 131: • Série 1 - Concreto traço 1:10
- Page 132 and 133: 3.8.3 FIGURA 3.21 - TRINCAS EM BLOC
- Page 134 and 135: FIGURA 3.23 - PRISMAS PARA ENSAIO D
- Page 136 and 137: agregado miúdo convencional pelo r
- Page 138 and 139: 4 APRESENTAÇÃO E DISCUSSÃO DOS R
- Page 140 and 141: TABELA 4.3 - CARACTERÍSTICAS DO RE
- Page 142 and 143: TABELA 4.4 - AGREGADO MIÚDO MINERA
- Page 144 and 145: TABELA 4.6 - CARACTERÍSTICAS QUÍM
- Page 146 and 147: A sílica ativa, a escória de alto
- Page 148 and 149: • Constatou-se que o resíduo de
- Page 152 and 153: Influência sobre as Característic
- Page 154 and 155: 133 Ao se analisar, tanto os valore
- Page 156 and 157: Quanto às características mecâni
- Page 158 and 159: Diante dos resultados determinados,
- Page 160 and 161: 4,5% de CaCl2.2H2O . Os resultados
- Page 162 and 163: TABELA 4.16 - COMPARAÇÃO ENTRE A
- Page 164 and 165: Temperatura ( o C) 120,0 100,0 80,0
- Page 166 and 167: TABELA 4.17 - PRÉ-TRATAMENTOS DO R
- Page 168 and 169: Massa Específica (kg/m3) 3000,0 20
- Page 170 and 171: 149 apresentaram diferenças estat
- Page 172 and 173: Resistência à Compressão (MPa) R
- Page 174 and 175: 153 Como pode ser notado, a maior R
- Page 176 and 177: Resi stência à Compressão (MPa)
- Page 178 and 179: Verificou-se, nos compósitos com t
- Page 180 and 181: Portanto, adotando nesta Fase do es
- Page 182 and 183: 11,279 14,988 18,697 22,406 26,115
- Page 184 and 185: TABELA 4.26 - VARIAÇÃO DA RESIST
- Page 186 and 187: TABELA 4.27 - PARÂMETROS ESTATÍST
- Page 188 and 189: TABELA 4.29 - SUBSTITUIÇÃO DO CIM
- Page 190 and 191: Portanto, adotando nesta Fase do es
- Page 192 and 193: Na Figura 4.28 apresenta-se a super
- Page 194 and 195: Analisando os valores das resistên
- Page 196 and 197: substituição por escória de alto
- Page 198 and 199: TABELA 4.38 - VARIAÇÃO DA RESIST
- Page 200 and 201:
TABELA 4.40 - CORRELAÇÕES PARCIAI
- Page 202 and 203:
TABELA 4.42 - VARIAÇÃO DA RESIST
- Page 204 and 205:
dependente: Utilizando o software I
- Page 206 and 207:
23,767 26,287 28,808 31,328 33,849
- Page 208 and 209:
187 resíduo de Pinus spp in natura
- Page 210 and 211:
(34,82 MPa) e para a Ref. 4 (resíd
- Page 212 and 213:
Resistência à Compressão (MPa) 6
- Page 214 and 215:
Conforme apresentado na Tabela 4.48
- Page 216 and 217:
verifica-se: alguns tipos, tais com
- Page 218 and 219:
4.3 RESULTADOS DA 3ª. FASE DA PESQ
- Page 220 and 221:
Tipo de Equipamento Empregado Umida
- Page 222 and 223:
201 fresco, produzidos com os traç
- Page 224 and 225:
Resistência à Compressão (MPa) 2
- Page 226 and 227:
TABELA 4.55 - SISTEMA ALTERNATIVO D
- Page 228 and 229:
moldagem e mecânicas (Tabela 4.59)
- Page 230 and 231:
A RC 7d dos corpos-de-prova cilínd
- Page 232 and 233:
Os concretos assim produzidos foram
- Page 234 and 235:
• 213 significativas para todos o
- Page 236 and 237:
pecífica (kg/m 3 Massa Es ) 2.400,
- Page 238 and 239:
agregado miúdo mineral e com os va
- Page 240 and 241:
do concreto • Verificaram-se dife
- Page 242 and 243:
• 221 convencional por 50% de res
- Page 244 and 245:
A evolução das resistências à c
- Page 246 and 247:
complementares, quanto a seu desemp
- Page 248 and 249:
Diante do verificado, pode-se const
- Page 250 and 251:
Quanto à absorção de água, veri
- Page 252 and 253:
231 in natura (Ref 2), com variaç
- Page 254 and 255:
233 enquanto que o menor valor de R
- Page 256 and 257:
• Outro fator relevante diz respe
- Page 258 and 259:
considerada, assim como a própria
- Page 260 and 261:
TABELA 4.75 - CARACTERÍSTICAS DOS
- Page 262 and 263:
5 CONCLUSÕES E CONSIDERAÇÕES FIN
- Page 264 and 265:
243 mecânicas dos blocos a serem p
- Page 266 and 267:
Enfim, pode-se estender a pesquisa
- Page 268 and 269:
__. NBR NM 45: Agregados - Determin
- Page 270 and 271:
CASTRO, V.G. Desenvolvimento de um
- Page 272 and 273:
JAYNE, B.A., BODIG, J. Mechanics of
- Page 274 and 275:
POUEY, M.T.F. Beneficiamentos da ci
- Page 276 and 277:
WEATHERWAX, R.C. and TARKOW, H. Eff
- Page 278 and 279:
ANEXO 1 ANOVA - 1ª FASE: ANÁLISE
- Page 280 and 281:
Resistência aos 28 dias de Idade:
- Page 282 and 283:
Resistência aos 7 dias de Idade An
- Page 284 and 285:
Absorção de Água Análise de Var
- Page 286 and 287:
Resistência à Compressão aos 28
- Page 288 and 289:
Resistência à Compressão aos 91
- Page 290 and 291:
Características Mecânicas Resist
- Page 292 and 293:
ANEXO 3 ANOVA - 3ª FASE: RESULTADO
- Page 294 and 295:
ANEXO 4 ANOVA - 4ª FASE: RESULTADO
- Page 296 and 297:
ANEXO 5 ANOVA - 5ª FASE: ANÁLISE
- Page 298 and 299:
Resistência à Compressão aos 7 d
- Page 300 and 301:
Índice de Vazios (Porosidade) Aná
- Page 302 and 303:
ANEXO 6 ANOVA - 6ª FASE: RESULTADO