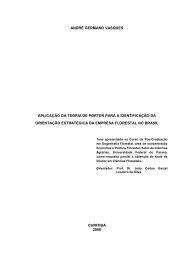
5.2.3 Teores dos elementos nutricionais de resistência das folhas de erva-mate O P conforme Tabela 17, mostra menor teor em folha com ampola, o Ca e o Si mostraram uma tendência ao aumento dos teores da testemunha para os tratamentos. As correlações para os elementos de resistência P, Si, K e Ca foram acima de 0,6 em amostras de folha média e sem ampola (Figura 06); para o Ca em amostra de folha com ampola, não houve correlação significativa (Figura 07). TABELA 17 – ELEMENTOS DE RESISTÊNCIA (P, Ca e K EM g.kg -1 e Si EM %), EM AMOSTRAS DE FOLHAS MÉDIAS, COM E SEM AMPOLA, VERÃO, ÁREA 02 Tratamentos P Ca ----------- g kg K Si -1 -------folhas médias -- % -- T00 3,58 a 3,40 a 16,14 b 0,01 a T40 3,59 ab 4,55 b 15,74 a 0,26 ab T60 3,66 bc 4,80 b 16,46 a 0,11 c T80 3,67 c 4,55 b folhas com ampola 15,73 a 0,19 bc T00 1,43 a 3,76 a 21,81 a 0,13 a T40 1,39 a 3,02 a 18,72 a 0,20 a T60 1,42 a 3,41 a 20,39 a 0,18 a T80 1,43 a 3,57 a folhas sem ampola 20,85 a 0,16 a T00 3,58 a 3,83 a 17,33 b 0,19 a T40 3,61 a 4,95 a 14,49 a 0,18 a T60 3,56 a 4,60 a 17,25 b 0,25 a T80 3,58 a 4,46 a 15,99 b 0,31 a NOTA: Números seguidos de letras iguais indicam não significância p< 0,10 63
P (g) K (g) P (g) Correlação entre conteúdo de N x P (folha média) 0,172 0,152 0,132 0,112 0,092 0,072 0 0,3 0,6 0,9 1,2 1,5 N (g) P = 0,0679313 + 0,0693595*N R = 0,868645** Correlação ente conteúdo de N x K (folha média) 0,76 0,66 0,56 0,46 0,36 0 0,3 0,6 0,9 1,2 1,5 N (g) K = 0,607073 + 0,221054*ln(N) R = 0,840891** Correlação entre conteúdo de N x P (folha s/ ampola) 0,15 0,13 0,11 0,09 0,07 0,05 0 0,3 0,6 0,9 1,2 1,5 1,8 N (g) P = 0,0517339 + 0,0475961*N R = 0,769776** Correlação entre conteúdo de N x Ca (folha s/ ampola) Ca (g) 0,33 0,29 0,25 0,21 0,17 0,13 0,09 0 0,3 0,6 0,9 1,2 1,5 1,8 N (g) Ca (g) Si (mg) K (g) Si (mg) Correlação entre conteúdo de N x Ca (folha média) 0,24 0,2 0,16 0,12 0,08 0,04 0 0 0,3 0,6 0,9 1,2 1,5 N (g) Ca = 0,175813 + 0,0994128*ln(N) R = 0,863732** Correlação entre conteúdo de N x Si (folha média) 1,5 1,2 0,9 0,6 0,3 0 0 0,3 0,6 0,9 1,2 1,5 N (g) Si = exp(-3,48066 + 3,14086*N) R = 0,634689* Correlação entre conteúdo de N x K (folha s/ ampola) 0,86 0,76 0,66 0,56 0,46 0,36 0,26 0 0,3 0,6 0,9 1,2 1,5 1,8 N (g) K = 0,340749 + 0,234385*N R = 0,600655** Correlação entre conteúdo de N x Si (folha s/ ampola) 1,8 1,5 1,2 0,9 0,6 0,3 0 0 0,3 0,6 0,9 1,2 1,5 1,8 Ca = exp(-2,48156 + 0,611329*Ns) Si = 0,368581 + 0,642521*Ns R = 0,736425** R = 0,741303* FIGURA 06 – CORRELAÇÃO ENTRE NT E ELEMENTOS DE RESISTÊNCIA, FOLHA MÉDIA E SEM AMPOLA, ÁREA 02 N (g) 64
- Page 1 and 2:
MARCIA MARZAGÃO RIBEIRO INFLUÊNCI
- Page 3 and 4:
AGRADECIMENTOS Expresso, meus since
- Page 5 and 6:
SUMÁRIO AGRADECIMENTOS............
- Page 7 and 8:
5.4 ÁREA 03 - EXPERIMENTO MORFOTIP
- Page 9 and 10:
TABELA 13 - PESO DE 100 FOLHAS (g)
- Page 11 and 12:
LISTA DE FIGURAS FIGURA 01 - COMPAR
- Page 13 and 14:
INFLUENCE OF NITROGEN FERTILIZATION
- Page 15 and 16:
produção de biomassa é o N que i
- Page 17 and 18:
3 REVISÃO BIBLIOGRÁFICA 3.1 CARAC
- Page 19 and 20:
tecido vegetal devem ser de mesma i
- Page 21 and 22:
exportação desses elementos duran
- Page 23 and 24:
conteúdo mineral com destaque para
- Page 25 and 26: Segundo REISSMANN et al. (2003) mor
- Page 27 and 28: aízes das plantas superiores e que
- Page 29 and 30: CASCON 3 (1955) citado por ALIKARID
- Page 31 and 32: minerais, teor e forma de matéria
- Page 33 and 34: OGLOBIN (1929) e FLORES (1983) estu
- Page 35 and 36: Quanto à estrutura, as galhas têm
- Page 37 and 38: finos estiletes quitinizados, semel
- Page 39 and 40: as erveiras a partir do quarto ou q
- Page 41 and 42: nitrogênio como importante para a
- Page 43 and 44: BRENNAN et al. (2001) estudaram a h
- Page 45 and 46: 4 MATERIAL E MÉTODOS Para a condu
- Page 47 and 48: de cloreto de potássio e 90g de su
- Page 49 and 50: ano desde a germinação. Correspon
- Page 51 and 52: TABELA 02 - ANÁLISE QUÍMICA DO SO
- Page 53 and 54: o hidróxido de sódio 32%. Após a
- Page 55 and 56: 4.4.5 Análise de silício Procedeu
- Page 57 and 58: 5 RESULTADOS E DISCUSSÕES 5.1 ÁRE
- Page 59 and 60: 5.1.1 Teor e conteúdo de Ntotal, a
- Page 61 and 62: de 50 Kg conforme comenta BENINI et
- Page 63 and 64: No período de 2002-2003 apresentou
- Page 65 and 66: tratamento com maior quantidade de
- Page 67 and 68: naturalmente ácido de pH = 3,8 acr
- Page 69 and 70: nitrogênio (AMBERGER, 1988) e incl
- Page 71 and 72: pouco definida (CARDOSO, et al. 200
- Page 73 and 74: mais os resíduos do inseto. Nas am
- Page 75: T80, que equivale a 80 kg de N.ha -
- Page 79 and 80: TABELA 18 - DEMAIS ELEMENTOS (MACRO
- Page 81 and 82: De acordo com BORILLE (2004) o teor
- Page 83 and 84: TABELA 24 - ELEMENTOS DE RESISTÊNC
- Page 85 and 86: 6 CONSIDERAÇÕES FINAIS • O forn
- Page 87 and 88: ÁREA 02 Quanto aos compostos nitro
- Page 89 and 90: 8 RECOMENDAÇÕES Recomenda-se o ma
- Page 91 and 92: BORILLE, W. M. A. Relação entre c
- Page 93 and 94: DRECHESEL, P.; ZECH, W. Foliar leve
- Page 95 and 96: HÜSER, A. WAADT, R. FLÜGE U. I.;
- Page 97 and 98: MATTOS, N. F. Estudos preliminares
- Page 99 and 100: mophotipen der Mate Pflanze (Ilex p
- Page 101 and 102: WHITE, I. M. e HODKINSON, I. D. Nin
- Page 103 and 104: ANEXOS ANEXO 01 - CROQUI DA ÁREA 0
- Page 105 and 106: ANEXO 03 - INTERPRETAÇÃO GERAL DO
- Page 107 and 108: ANEXO 07 - DADOS RELATIVOS A PLUVIO
- Page 109 and 110: Analysis of Variance for Calcio - T
- Page 111 and 112: Analysis of Variance for Cobre - Ty
- Page 113 and 114: Analysis of Variance for Amonia - T
- Page 115 and 116: Multiple Range Tests for N_conteudo
- Page 117 and 118: Analysis of Variance for Ferro - Ty
- Page 119 and 120: Analysis of Variance for Amonia_log
- Page 121 and 122: Multiple Range Tests for Fosforo by
- Page 123 and 124: Multiple Range Tests for Mg_coss by
- Page 125 and 126: Multiple Range Tests for Zinco by T
- Page 127 and 128:
Bartlett's test: 2,2145 P-Value = 0
- Page 129 and 130:
Analysis of Variance for Mn_coss -
- Page 131 and 132:
Multiple Range Tests for Nitrogenio
- Page 133 and 134:
Analysis of Variance for Cobre - Ty
- Page 135 and 136:
Bartlett's test: 1,64816 P-Value =
- Page 137 and 138:
Analysis of Variance for Potassio -
- Page 139 and 140:
Analysis of Variance for Cobre - Ty
- Page 141 and 142:
Multiple Range Tests for Nitrato_lo
- Page 143 and 144:
Multiple Range Tests for Ca_sen by
- Page 145 and 146:
ANOVA Table for zinco by Morfotipo
- Page 147 and 148:
Analysis of Variance for 2002 - Typ
- Page 149 and 150:
Analysis of Variance for 25_11_2002
- Page 151 and 152:
Multiple Range Tests for 2002_2003
- Page 153 and 154:
Multiple Range Tests for Marco_2004
- Page 155 and 156:
Multiple Range Tests for Dezembro 2
- Page 157 and 158:
Bartlett's test: 1,39058 P-Value =
- Page 159 and 160:
ANOVA Table for I_10_log by Morfoti
- Page 161 and 162:
148 ANEXO 10 - MÉDIA DOS TEORES DE
- Page 163 and 164:
150 ANEXO 12 - MÉDIA DOS CONTEÚDO