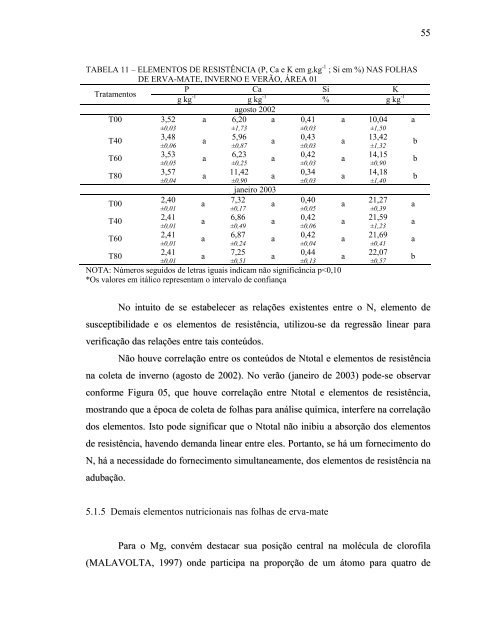
TABELA 11 – ELEMENTOS DE RESISTÊNCIA (P, Ca e K em g.kg -1 ; Si em %) NAS FOLHAS DE ERVA-MATE, INVERNO E VERÃO, ÁREA 01 Tratamentos P g kg Ca Si K -1 g kg -1 % g kg -1 agosto 2002 T00 3,52 ±0,03 a 6,20 ±1,73 a 0,41 ±0,03 a 10,04 ±1,50 a T40 3,48 a 5,96 a 0,43 a 13,42 b T60 T80 ±0,06 3,53 ±0,05 3,57 ±0,04 a a ±0,87 6,23 ±0,25 a 11,42 ±0,90 a janeiro 2003 7,32 ±0,17 a 6,86 ±0,49 a 6,87 a ±0,03 0,42 ±0,03 0,34 ±0,03 T00 2,40 ±0,01 a 0,40 ±0,05 T40 2,41 ±0,01 a 0,42 ±0,06 T60 2,41 ±0,01 a ±0,24 0,42 ±0,04 T80 2,41 ±0,01 a 7,25 ±0,51 a 0,44 ±0,13 NOTA: Números seguidos de letras iguais indicam não significância p
nitrogênio (AMBERGER, 1988) e inclusive como coadjuvante na absorção do P. Ambos os aspectos extremamente importantes para a produção de biomassa. Neste trabalho, os teores de Mg não variaram em agosto de 2002. Em janeiro de 2003 a testemunha foi significativamente menor e os tratamentos T60 e T80 significativamente maiores (Tabela 12) . O teor de Fe (Tabela 12) apresentou-se igual entre tratamentos no inverno, no verão os teores diminuíram, sugerindo um efeito sazonal (REISSMANN, 2003). Nos aspectos gerais, os teores encontrados acham-se abaixo dos normalmente reportados para a espécie. P (g) Ca (g) 0,26 0,23 0,2 0,17 0,14 Correlação entre conteúdo de N x P 0,11 1 1,4 1,8 2,2 2,6 3 3,4 0,74 0,64 0,54 0,44 N (g) P = 0,0582463 + 0,052834*N R = 0,899501** Correlação entre conteúdo de N x Ca 0,34 1 1,4 1,8 2,2 2,6 3 3,4 N (g) K (g) Si (g) 2,5 2,2 1,9 1,6 1,3 Correlação entre conteúdo de N x K 1 1 1,4 1,8 2,2 2,6 3 3,4 5 4 3 2 1 N (g) K = 0,561648 + 0,455933*N R = 0,869178** Correlação entre conteúdo de N x Si 0 1 1,4 1,8 2,2 2,6 3 3,4 Ca = 0,213649 + 0,133833*N Si = 1,03508 + 0,840495*N R = 0,786982** R = 0,469671* FIGURA 05 – CORRELAÇÃO ENTRE NT E ELEMENTOS DE RESISTÊNCIA, VERÃO, ÁREA 01 Além disso, observa-se que o Fe no T40 - verão, obteve um aumento que se manteve significativo até a dose máxima T80. Há a possibilidade deste aumento também ser conseqüência da forma de adubo amoniacal. Ao contrário, tem sido constatado que formas de adubo nítrico prejudicam o aproveitamento fisiológico do Fe (SMOLDERS et al. 1997). N (g) 56
- Page 1 and 2:
MARCIA MARZAGÃO RIBEIRO INFLUÊNCI
- Page 3 and 4:
AGRADECIMENTOS Expresso, meus since
- Page 5 and 6:
SUMÁRIO AGRADECIMENTOS............
- Page 7 and 8:
5.4 ÁREA 03 - EXPERIMENTO MORFOTIP
- Page 9 and 10:
TABELA 13 - PESO DE 100 FOLHAS (g)
- Page 11 and 12:
LISTA DE FIGURAS FIGURA 01 - COMPAR
- Page 13 and 14:
INFLUENCE OF NITROGEN FERTILIZATION
- Page 15 and 16:
produção de biomassa é o N que i
- Page 17 and 18: 3 REVISÃO BIBLIOGRÁFICA 3.1 CARAC
- Page 19 and 20: tecido vegetal devem ser de mesma i
- Page 21 and 22: exportação desses elementos duran
- Page 23 and 24: conteúdo mineral com destaque para
- Page 25 and 26: Segundo REISSMANN et al. (2003) mor
- Page 27 and 28: aízes das plantas superiores e que
- Page 29 and 30: CASCON 3 (1955) citado por ALIKARID
- Page 31 and 32: minerais, teor e forma de matéria
- Page 33 and 34: OGLOBIN (1929) e FLORES (1983) estu
- Page 35 and 36: Quanto à estrutura, as galhas têm
- Page 37 and 38: finos estiletes quitinizados, semel
- Page 39 and 40: as erveiras a partir do quarto ou q
- Page 41 and 42: nitrogênio como importante para a
- Page 43 and 44: BRENNAN et al. (2001) estudaram a h
- Page 45 and 46: 4 MATERIAL E MÉTODOS Para a condu
- Page 47 and 48: de cloreto de potássio e 90g de su
- Page 49 and 50: ano desde a germinação. Correspon
- Page 51 and 52: TABELA 02 - ANÁLISE QUÍMICA DO SO
- Page 53 and 54: o hidróxido de sódio 32%. Após a
- Page 55 and 56: 4.4.5 Análise de silício Procedeu
- Page 57 and 58: 5 RESULTADOS E DISCUSSÕES 5.1 ÁRE
- Page 59 and 60: 5.1.1 Teor e conteúdo de Ntotal, a
- Page 61 and 62: de 50 Kg conforme comenta BENINI et
- Page 63 and 64: No período de 2002-2003 apresentou
- Page 65 and 66: tratamento com maior quantidade de
- Page 67: naturalmente ácido de pH = 3,8 acr
- Page 71 and 72: pouco definida (CARDOSO, et al. 200
- Page 73 and 74: mais os resíduos do inseto. Nas am
- Page 75 and 76: T80, que equivale a 80 kg de N.ha -
- Page 77 and 78: P (g) K (g) P (g) Correlação entr
- Page 79 and 80: TABELA 18 - DEMAIS ELEMENTOS (MACRO
- Page 81 and 82: De acordo com BORILLE (2004) o teor
- Page 83 and 84: TABELA 24 - ELEMENTOS DE RESISTÊNC
- Page 85 and 86: 6 CONSIDERAÇÕES FINAIS • O forn
- Page 87 and 88: ÁREA 02 Quanto aos compostos nitro
- Page 89 and 90: 8 RECOMENDAÇÕES Recomenda-se o ma
- Page 91 and 92: BORILLE, W. M. A. Relação entre c
- Page 93 and 94: DRECHESEL, P.; ZECH, W. Foliar leve
- Page 95 and 96: HÜSER, A. WAADT, R. FLÜGE U. I.;
- Page 97 and 98: MATTOS, N. F. Estudos preliminares
- Page 99 and 100: mophotipen der Mate Pflanze (Ilex p
- Page 101 and 102: WHITE, I. M. e HODKINSON, I. D. Nin
- Page 103 and 104: ANEXOS ANEXO 01 - CROQUI DA ÁREA 0
- Page 105 and 106: ANEXO 03 - INTERPRETAÇÃO GERAL DO
- Page 107 and 108: ANEXO 07 - DADOS RELATIVOS A PLUVIO
- Page 109 and 110: Analysis of Variance for Calcio - T
- Page 111 and 112: Analysis of Variance for Cobre - Ty
- Page 113 and 114: Analysis of Variance for Amonia - T
- Page 115 and 116: Multiple Range Tests for N_conteudo
- Page 117 and 118: Analysis of Variance for Ferro - Ty
- Page 119 and 120:
Analysis of Variance for Amonia_log
- Page 121 and 122:
Multiple Range Tests for Fosforo by
- Page 123 and 124:
Multiple Range Tests for Mg_coss by
- Page 125 and 126:
Multiple Range Tests for Zinco by T
- Page 127 and 128:
Bartlett's test: 2,2145 P-Value = 0
- Page 129 and 130:
Analysis of Variance for Mn_coss -
- Page 131 and 132:
Multiple Range Tests for Nitrogenio
- Page 133 and 134:
Analysis of Variance for Cobre - Ty
- Page 135 and 136:
Bartlett's test: 1,64816 P-Value =
- Page 137 and 138:
Analysis of Variance for Potassio -
- Page 139 and 140:
Analysis of Variance for Cobre - Ty
- Page 141 and 142:
Multiple Range Tests for Nitrato_lo
- Page 143 and 144:
Multiple Range Tests for Ca_sen by
- Page 145 and 146:
ANOVA Table for zinco by Morfotipo
- Page 147 and 148:
Analysis of Variance for 2002 - Typ
- Page 149 and 150:
Analysis of Variance for 25_11_2002
- Page 151 and 152:
Multiple Range Tests for 2002_2003
- Page 153 and 154:
Multiple Range Tests for Marco_2004
- Page 155 and 156:
Multiple Range Tests for Dezembro 2
- Page 157 and 158:
Bartlett's test: 1,39058 P-Value =
- Page 159 and 160:
ANOVA Table for I_10_log by Morfoti
- Page 161 and 162:
148 ANEXO 10 - MÉDIA DOS TEORES DE
- Page 163 and 164:
150 ANEXO 12 - MÉDIA DOS CONTEÚDO