MARCIA MARZAGÃO RIBEIRO INFLUÊNCIA DA ADUBAÇÃO ...
MARCIA MARZAGÃO RIBEIRO INFLUÊNCIA DA ADUBAÇÃO ... MARCIA MARZAGÃO RIBEIRO INFLUÊNCIA DA ADUBAÇÃO ...
Analysis of Variance for 24_02_2003 - Type III Sums of Squares -------------------------------------------------------------------------------- Source Sum of Squares Df Mean Square F-Ratio P-Value -------------------------------------------------------------------------------- MAIN EFFECTS A:Bloco 218,444 4 54,6111 0,46 0,7626 B:Tratamento 1154,43 3 384,81 3,25 0,0598 RESIDUAL 1419,4 12 118,283 -------------------------------------------------------------------------------- TOTAL (CORRECTED) 2792,28 19 -------------------------------------------------------------------------------- All F-ratios are based on the residual mean square error. Multiple Range Tests for 24_02_2003 by Tratamento -------------------------------------------------------------------------------- Method: 90,0 percent Duncan Tratamento Count LS Mean Homogeneous Groups -------------------------------------------------------------------------------- 0 5 39,658 X 60 5 54,736 X 40 5 55,466 X 80 5 59,726 X -------------------------------------------------------------------------------- Contrast Difference -------------------------------------------------------------------------------- 0 - 40 *-15,808 0 - 60 *-15,078 0 - 80 *-20,068 40 - 60 0,73 40 - 80 -4,26 60 - 80 -4,99 -------------------------------------------------------------------------------- * denotes a statistically significant difference. 9.4 Área 01- Dano, Soma do Período de 2002/2003 Bartlett's test: 1,08239 P-Value = 0,765694 Analysis of Variance for 2002_2003 - Type III Sums of Squares -------------------------------------------------------------------------------- Source Sum of Squares Df Mean Square F-Ratio P-Value -------------------------------------------------------------------------------- MAIN EFFECTS A:Bloco 21039,3 4 5259,82 1,61 0,2358 B:Tratamento 29451,6 3 9817,2 3,00 0,0728 RESIDUAL 39279,0 12 3273,25 -------------------------------------------------------------------------------- TOTAL (CORRECTED) 89769,9 19 -------------------------------------------------------------------------------- All F-ratios are based on the residual mean square error. 137
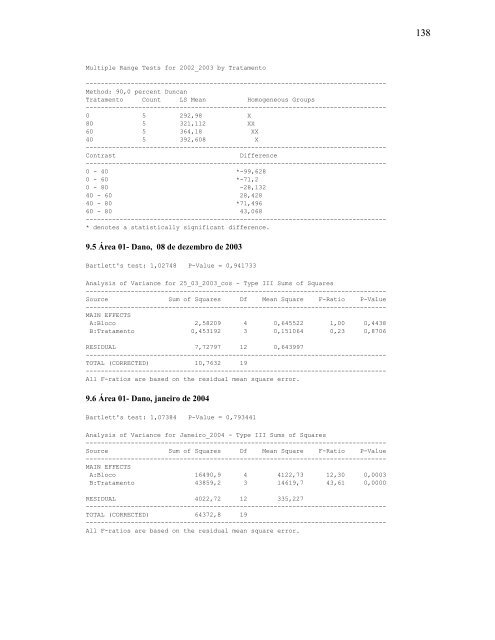
Multiple Range Tests for 2002_2003 by Tratamento -------------------------------------------------------------------------------- Method: 90,0 percent Duncan Tratamento Count LS Mean Homogeneous Groups -------------------------------------------------------------------------------- 0 5 292,98 X 80 5 321,112 XX 60 5 364,18 XX 40 5 392,608 X -------------------------------------------------------------------------------- Contrast Difference -------------------------------------------------------------------------------- 0 - 40 *-99,628 0 - 60 *-71,2 0 - 80 -28,132 40 - 60 28,428 40 - 80 *71,496 60 - 80 43,068 -------------------------------------------------------------------------------- * denotes a statistically significant difference. 9.5 Área 01- Dano, 08 de dezembro de 2003 Bartlett's test: 1,02748 P-Value = 0,941733 Analysis of Variance for 25_03_2003_cos - Type III Sums of Squares -------------------------------------------------------------------------------- Source Sum of Squares Df Mean Square F-Ratio P-Value -------------------------------------------------------------------------------- MAIN EFFECTS A:Bloco 2,58209 4 0,645522 1,00 0,4438 B:Tratamento 0,453192 3 0,151064 0,23 0,8706 RESIDUAL 7,72797 12 0,643997 -------------------------------------------------------------------------------- TOTAL (CORRECTED) 10,7632 19 -------------------------------------------------------------------------------- All F-ratios are based on the residual mean square error. 9.6 Área 01- Dano, janeiro de 2004 Bartlett's test: 1,07384 P-Value = 0,793441 Analysis of Variance for Janeiro_2004 - Type III Sums of Squares -------------------------------------------------------------------------------- Source Sum of Squares Df Mean Square F-Ratio P-Value -------------------------------------------------------------------------------- MAIN EFFECTS A:Bloco 16490,9 4 4122,73 12,30 0,0003 B:Tratamento 43859,2 3 14619,7 43,61 0,0000 RESIDUAL 4022,72 12 335,227 -------------------------------------------------------------------------------- TOTAL (CORRECTED) 64372,8 19 -------------------------------------------------------------------------------- All F-ratios are based on the residual mean square error. 138
- Page 99 and 100: mophotipen der Mate Pflanze (Ilex p
- Page 101 and 102: WHITE, I. M. e HODKINSON, I. D. Nin
- Page 103 and 104: ANEXOS ANEXO 01 - CROQUI DA ÁREA 0
- Page 105 and 106: ANEXO 03 - INTERPRETAÇÃO GERAL DO
- Page 107 and 108: ANEXO 07 - DADOS RELATIVOS A PLUVIO
- Page 109 and 110: Analysis of Variance for Calcio - T
- Page 111 and 112: Analysis of Variance for Cobre - Ty
- Page 113 and 114: Analysis of Variance for Amonia - T
- Page 115 and 116: Multiple Range Tests for N_conteudo
- Page 117 and 118: Analysis of Variance for Ferro - Ty
- Page 119 and 120: Analysis of Variance for Amonia_log
- Page 121 and 122: Multiple Range Tests for Fosforo by
- Page 123 and 124: Multiple Range Tests for Mg_coss by
- Page 125 and 126: Multiple Range Tests for Zinco by T
- Page 127 and 128: Bartlett's test: 2,2145 P-Value = 0
- Page 129 and 130: Analysis of Variance for Mn_coss -
- Page 131 and 132: Multiple Range Tests for Nitrogenio
- Page 133 and 134: Analysis of Variance for Cobre - Ty
- Page 135 and 136: Bartlett's test: 1,64816 P-Value =
- Page 137 and 138: Analysis of Variance for Potassio -
- Page 139 and 140: Analysis of Variance for Cobre - Ty
- Page 141 and 142: Multiple Range Tests for Nitrato_lo
- Page 143 and 144: Multiple Range Tests for Ca_sen by
- Page 145 and 146: ANOVA Table for zinco by Morfotipo
- Page 147 and 148: Analysis of Variance for 2002 - Typ
- Page 149: Analysis of Variance for 25_11_2002
- Page 153 and 154: Multiple Range Tests for Marco_2004
- Page 155 and 156: Multiple Range Tests for Dezembro 2
- Page 157 and 158: Bartlett's test: 1,39058 P-Value =
- Page 159 and 160: ANOVA Table for I_10_log by Morfoti
- Page 161 and 162: 148 ANEXO 10 - MÉDIA DOS TEORES DE
- Page 163 and 164: 150 ANEXO 12 - MÉDIA DOS CONTEÚDO
Multiple Range Tests for 2002_2003 by Tratamento<br />
--------------------------------------------------------------------------------<br />
Method: 90,0 percent Duncan<br />
Tratamento Count LS Mean Homogeneous Groups<br />
--------------------------------------------------------------------------------<br />
0 5 292,98 X<br />
80 5 321,112 XX<br />
60 5 364,18 XX<br />
40 5 392,608 X<br />
--------------------------------------------------------------------------------<br />
Contrast Difference<br />
--------------------------------------------------------------------------------<br />
0 - 40 *-99,628<br />
0 - 60 *-71,2<br />
0 - 80 -28,132<br />
40 - 60 28,428<br />
40 - 80 *71,496<br />
60 - 80 43,068<br />
--------------------------------------------------------------------------------<br />
* denotes a statistically significant difference.<br />
9.5 Área 01- Dano, 08 de dezembro de 2003<br />
Bartlett's test: 1,02748 P-Value = 0,941733<br />
Analysis of Variance for 25_03_2003_cos - Type III Sums of Squares<br />
--------------------------------------------------------------------------------<br />
Source Sum of Squares Df Mean Square F-Ratio P-Value<br />
--------------------------------------------------------------------------------<br />
MAIN EFFECTS<br />
A:Bloco 2,58209 4 0,645522 1,00 0,4438<br />
B:Tratamento 0,453192 3 0,151064 0,23 0,8706<br />
RESIDUAL 7,72797 12 0,643997<br />
--------------------------------------------------------------------------------<br />
TOTAL (CORRECTED) 10,7632 19<br />
--------------------------------------------------------------------------------<br />
All F-ratios are based on the residual mean square error.<br />
9.6 Área 01- Dano, janeiro de 2004<br />
Bartlett's test: 1,07384 P-Value = 0,793441<br />
Analysis of Variance for Janeiro_2004 - Type III Sums of Squares<br />
--------------------------------------------------------------------------------<br />
Source Sum of Squares Df Mean Square F-Ratio P-Value<br />
--------------------------------------------------------------------------------<br />
MAIN EFFECTS<br />
A:Bloco 16490,9 4 4122,73 12,30 0,0003<br />
B:Tratamento 43859,2 3 14619,7 43,61 0,0000<br />
RESIDUAL 4022,72 12 335,227<br />
--------------------------------------------------------------------------------<br />
TOTAL (CORRECTED) 64372,8 19<br />
--------------------------------------------------------------------------------<br />
All F-ratios are based on the residual mean square error.<br />
138


