MARCIA MARZAGÃO RIBEIRO INFLUÊNCIA DA ADUBAÇÃO ...
MARCIA MARZAGÃO RIBEIRO INFLUÊNCIA DA ADUBAÇÃO ... MARCIA MARZAGÃO RIBEIRO INFLUÊNCIA DA ADUBAÇÃO ...
Analysis of Variance for Aminoacido - Type III Sums of Squares -------------------------------------------------------------------------------- Source Sum of Squares Df Mean Square F-Ratio P-Value -------------------------------------------------------------------------------- MAIN EFFECTS A:Bloco 63,1498 4 15,7875 0,23 0,9171 B:Tratamento 266,434 3 88,8113 1,29 0,3238 RESIDUAL 828,706 12 69,0588 -------------------------------------------------------------------------------- TOTAL (CORRECTED) 1158,29 19 -------------------------------------------------------------------------------- All F-ratios are based on the residual mean square error. 3 Área 02- janeiro 2003, folha média 3.1 Nitrogênio Bartlett's test: 1,09534 P-Value = 0,724473 Analysis of Variance for N_cos - Type III Sums of Squares -------------------------------------------------------------------------------- Source Sum of Squares Df Mean Square F-Ratio P-Value -------------------------------------------------------------------------------- MAIN EFFECTS A:Bloco 3,8453 4 0,961325 2,37 0,1109 B:Tratamento 1,93784 3 0,645947 1,59 0,2428 RESIDUAL 4,8672 12 0,4056 -------------------------------------------------------------------------------- TOTAL (CORRECTED) 10,6503 19 -------------------------------------------------------------------------------- All F-ratios are based on the residual mean square error. 3.2 Fósforo Bartlett's test: 1,42513 P-Value = 0,162276 Analysis of Variance for Fosforo - Type III Sums of Squares -------------------------------------------------------------------------------- Source Sum of Squares Df Mean Square F-Ratio P-Value -------------------------------------------------------------------------------- MAIN EFFECTS A:Bloco 0,02752 4 0,00688 1,59 0,2412 B:Tratamento 0,03252 3 0,01084 2,50 0,1094 RESIDUAL 0,05208 12 0,00434 -------------------------------------------------------------------------------- TOTAL (CORRECTED) 0,11212 19 -------------------------------------------------------------------------------- All F-ratios are based on the residual mean square error. 107
Multiple Range Tests for Fosforo by Tratamento -------------------------------------------------------------------------------- Method: 90,0 percent Duncan Tratamento Count LS Mean Homogeneous Groups -------------------------------------------------------------------------------- 0 5 3,576 X 40 5 3,588 XX 60 5 3,658 XX 80 5 3,666 X -------------------------------------------------------------------------------- Contrast Difference -------------------------------------------------------------------------------- 0 - 40 -0,012 0 - 60 *-0,082 0 - 80 *-0,09 40 - 60 -0,07 40 - 80 *-0,078 60 - 80 -0,008 -------------------------------------------------------------------------------- * denotes a statistically significant difference. 3.3 Potássio Bartlett's test: 1,45549 P-Value = 0,142336 Analysis of Variance for K_cos - Type III Sums of Squares -------------------------------------------------------------------------------- Source Sum of Squares Df Mean Square F-Ratio P-Value -------------------------------------------------------------------------------- MAIN EFFECTS A:Bloco 0,952508 4 0,238127 1,04 0,4272 B:Tratamento 1,94287 3 0,647622 2,82 0,0836 RESIDUAL 2,75104 12 0,229253 -------------------------------------------------------------------------------- TOTAL (CORRECTED) 5,64641 19 -------------------------------------------------------------------------------- All F-ratios are based on the residual mean square error. Multiple Range Tests for K_cos by Tratamento -------------------------------------------------------------------------------- Method: 90,0 percent Duncan Tratamento Count LS Mean Homogeneous Groups -------------------------------------------------------------------------------- 60 5 -0,675938 X 80 5 -0,647625 X 40 5 -0,500424 X 0 5 0,0951545 X -------------------------------------------------------------------------------- Contrast Difference -------------------------------------------------------------------------------- 0 - 40 *0,595579 0 - 60 *0,771093 0 - 80 *0,742779 40 - 60 0,175514 40 - 80 0,1472 60 - 80 -0,0283137 -------------------------------------------------------------------------------- * denotes a statistically significant difference. 3.4 Cálcio 108
- Page 69 and 70: nitrogênio (AMBERGER, 1988) e incl
- Page 71 and 72: pouco definida (CARDOSO, et al. 200
- Page 73 and 74: mais os resíduos do inseto. Nas am
- Page 75 and 76: T80, que equivale a 80 kg de N.ha -
- Page 77 and 78: P (g) K (g) P (g) Correlação entr
- Page 79 and 80: TABELA 18 - DEMAIS ELEMENTOS (MACRO
- Page 81 and 82: De acordo com BORILLE (2004) o teor
- Page 83 and 84: TABELA 24 - ELEMENTOS DE RESISTÊNC
- Page 85 and 86: 6 CONSIDERAÇÕES FINAIS • O forn
- Page 87 and 88: ÁREA 02 Quanto aos compostos nitro
- Page 89 and 90: 8 RECOMENDAÇÕES Recomenda-se o ma
- Page 91 and 92: BORILLE, W. M. A. Relação entre c
- Page 93 and 94: DRECHESEL, P.; ZECH, W. Foliar leve
- Page 95 and 96: HÜSER, A. WAADT, R. FLÜGE U. I.;
- Page 97 and 98: MATTOS, N. F. Estudos preliminares
- Page 99 and 100: mophotipen der Mate Pflanze (Ilex p
- Page 101 and 102: WHITE, I. M. e HODKINSON, I. D. Nin
- Page 103 and 104: ANEXOS ANEXO 01 - CROQUI DA ÁREA 0
- Page 105 and 106: ANEXO 03 - INTERPRETAÇÃO GERAL DO
- Page 107 and 108: ANEXO 07 - DADOS RELATIVOS A PLUVIO
- Page 109 and 110: Analysis of Variance for Calcio - T
- Page 111 and 112: Analysis of Variance for Cobre - Ty
- Page 113 and 114: Analysis of Variance for Amonia - T
- Page 115 and 116: Multiple Range Tests for N_conteudo
- Page 117 and 118: Analysis of Variance for Ferro - Ty
- Page 119: Analysis of Variance for Amonia_log
- Page 123 and 124: Multiple Range Tests for Mg_coss by
- Page 125 and 126: Multiple Range Tests for Zinco by T
- Page 127 and 128: Bartlett's test: 2,2145 P-Value = 0
- Page 129 and 130: Analysis of Variance for Mn_coss -
- Page 131 and 132: Multiple Range Tests for Nitrogenio
- Page 133 and 134: Analysis of Variance for Cobre - Ty
- Page 135 and 136: Bartlett's test: 1,64816 P-Value =
- Page 137 and 138: Analysis of Variance for Potassio -
- Page 139 and 140: Analysis of Variance for Cobre - Ty
- Page 141 and 142: Multiple Range Tests for Nitrato_lo
- Page 143 and 144: Multiple Range Tests for Ca_sen by
- Page 145 and 146: ANOVA Table for zinco by Morfotipo
- Page 147 and 148: Analysis of Variance for 2002 - Typ
- Page 149 and 150: Analysis of Variance for 25_11_2002
- Page 151 and 152: Multiple Range Tests for 2002_2003
- Page 153 and 154: Multiple Range Tests for Marco_2004
- Page 155 and 156: Multiple Range Tests for Dezembro 2
- Page 157 and 158: Bartlett's test: 1,39058 P-Value =
- Page 159 and 160: ANOVA Table for I_10_log by Morfoti
- Page 161 and 162: 148 ANEXO 10 - MÉDIA DOS TEORES DE
- Page 163 and 164: 150 ANEXO 12 - MÉDIA DOS CONTEÚDO
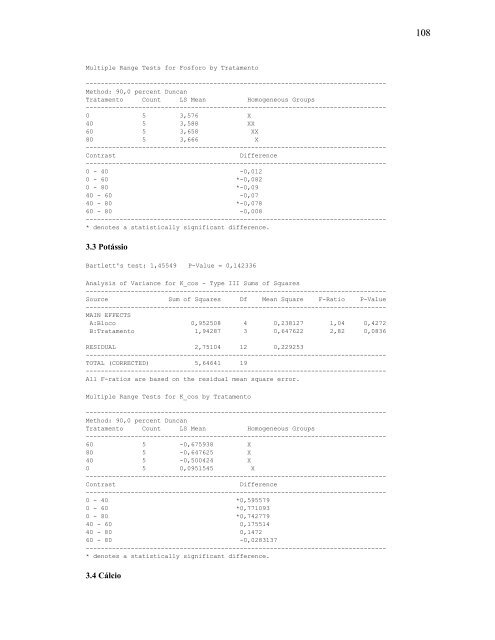
Multiple Range Tests for Fosforo by Tratamento<br />
--------------------------------------------------------------------------------<br />
Method: 90,0 percent Duncan<br />
Tratamento Count LS Mean Homogeneous Groups<br />
--------------------------------------------------------------------------------<br />
0 5 3,576 X<br />
40 5 3,588 XX<br />
60 5 3,658 XX<br />
80 5 3,666 X<br />
--------------------------------------------------------------------------------<br />
Contrast Difference<br />
--------------------------------------------------------------------------------<br />
0 - 40 -0,012<br />
0 - 60 *-0,082<br />
0 - 80 *-0,09<br />
40 - 60 -0,07<br />
40 - 80 *-0,078<br />
60 - 80 -0,008<br />
--------------------------------------------------------------------------------<br />
* denotes a statistically significant difference.<br />
3.3 Potássio<br />
Bartlett's test: 1,45549 P-Value = 0,142336<br />
Analysis of Variance for K_cos - Type III Sums of Squares<br />
--------------------------------------------------------------------------------<br />
Source Sum of Squares Df Mean Square F-Ratio P-Value<br />
--------------------------------------------------------------------------------<br />
MAIN EFFECTS<br />
A:Bloco 0,952508 4 0,238127 1,04 0,4272<br />
B:Tratamento 1,94287 3 0,647622 2,82 0,0836<br />
RESIDUAL 2,75104 12 0,229253<br />
--------------------------------------------------------------------------------<br />
TOTAL (CORRECTED) 5,64641 19<br />
--------------------------------------------------------------------------------<br />
All F-ratios are based on the residual mean square error.<br />
Multiple Range Tests for K_cos by Tratamento<br />
--------------------------------------------------------------------------------<br />
Method: 90,0 percent Duncan<br />
Tratamento Count LS Mean Homogeneous Groups<br />
--------------------------------------------------------------------------------<br />
60 5 -0,675938 X<br />
80 5 -0,647625 X<br />
40 5 -0,500424 X<br />
0 5 0,0951545 X<br />
--------------------------------------------------------------------------------<br />
Contrast Difference<br />
--------------------------------------------------------------------------------<br />
0 - 40 *0,595579<br />
0 - 60 *0,771093<br />
0 - 80 *0,742779<br />
40 - 60 0,175514<br />
40 - 80 0,1472<br />
60 - 80 -0,0283137<br />
--------------------------------------------------------------------------------<br />
* denotes a statistically significant difference.<br />
3.4 Cálcio<br />
108


