Tese em PDF - departamento de engenharia florestal - ufpr ...
Tese em PDF - departamento de engenharia florestal - ufpr ...
Tese em PDF - departamento de engenharia florestal - ufpr ...

Create successful ePaper yourself
Turn your PDF publications into a flip-book with our unique Google optimized e-Paper software.
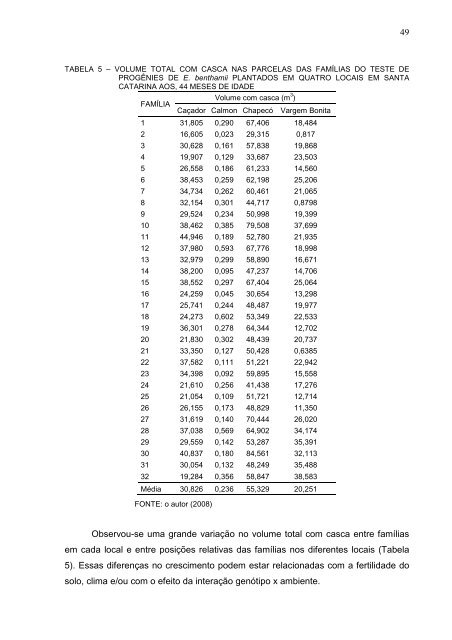
TABELA 5 – VOLUME TOTAL COM CASCA NAS PARCELAS DAS FAMÍLIAS DO TESTE DE<br />
PROGÊNIES DE E. benthamii PLANTADOS EM QUATRO LOCAIS EM SANTA<br />
CATARINA AOS, 44 MESES DE IDADE<br />
FAMÍLIA<br />
Volume com casca (m 3 )<br />
Caçador Calmon Chapecó Varg<strong>em</strong> Bonita<br />
1 31,805 0,290 67,406 18,484<br />
2 16,605 0,023 29,315 0,817<br />
3 30,628 0,161 57,838 19,868<br />
4 19,907 0,129 33,687 23,503<br />
5 26,558 0,186 61,233 14,560<br />
6 38,453 0,259 62,198 25,206<br />
7 34,734 0,262 60,461 21,065<br />
8 32,154 0,301 44,717 0,8798<br />
9 29,524 0,234 50,998 19,399<br />
10 38,462 0,385 79,508 37,699<br />
11 44,946 0,189 52,780 21,935<br />
12 37,980 0,593 67,776 18,998<br />
13 32,979 0,299 58,890 16,671<br />
14 38,200 0,095 47,237 14,706<br />
15 38,552 0,297 67,404 25,064<br />
16 24,259 0,045 30,654 13,298<br />
17 25,741 0,244 48,487 19,977<br />
18 24,273 0,602 53,349 22,533<br />
19 36,301 0,278 64,344 12,702<br />
20 21,830 0,302 48,439 20,737<br />
21 33,350 0,127 50,428 0,6385<br />
22 37,582 0,111 51,221 22,942<br />
23 34,398 0,092 59,895 15,558<br />
24 21,610 0,256 41,438 17,276<br />
25 21,054 0,109 51,721 12,714<br />
26 26,155 0,173 48,829 11,350<br />
27 31,619 0,140 70,444 26,020<br />
28 37,038 0,569 64,902 34,174<br />
29 29,559 0,142 53,287 35,391<br />
30 40,837 0,180 84,561 32,113<br />
31 30,054 0,132 48,249 35,488<br />
32 19,284 0,356 58,847 38,583<br />
Média 30,826 0,236 55,329 20,251<br />
FONTE: o autor (2008)<br />
Observou-se uma gran<strong>de</strong> variação no volume total com casca entre famílias<br />
<strong>em</strong> cada local e entre posições relativas das famílias nos diferentes locais (Tabela<br />
5). Essas diferenças no crescimento pod<strong>em</strong> estar relacionadas com a fertilida<strong>de</strong> do<br />
solo, clima e/ou com o efeito da interação genótipo x ambiente.<br />
49