4. índice da bolsa de valores de são paulo
4. índice da bolsa de valores de são paulo
4. índice da bolsa de valores de são paulo

You also want an ePaper? Increase the reach of your titles
YUMPU automatically turns print PDFs into web optimized ePapers that Google loves.
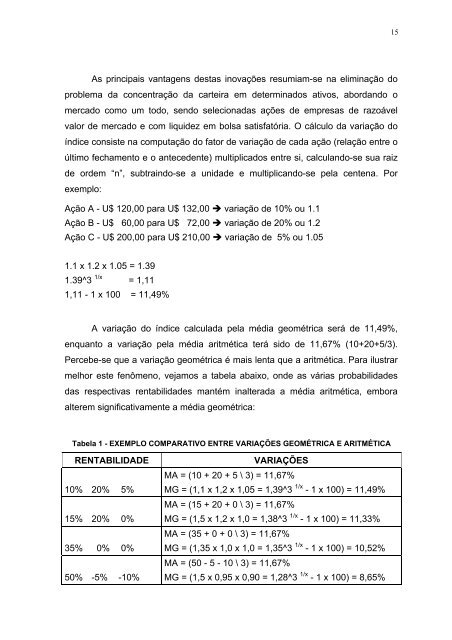
As principais vantagens <strong>de</strong>stas inovações resumiam-se na eliminação do<br />
problema <strong>da</strong> concentração <strong>da</strong> carteira em <strong>de</strong>terminados ativos, abor<strong>da</strong>ndo o<br />
mercado como um todo, sendo seleciona<strong>da</strong>s ações <strong>de</strong> empresas <strong>de</strong> razoável<br />
valor <strong>de</strong> mercado e com liqui<strong>de</strong>z em <strong>bolsa</strong> satisfatória. O cálculo <strong>da</strong> variação do<br />
<strong>índice</strong> consiste na computação do fator <strong>de</strong> variação <strong>de</strong> ca<strong>da</strong> ação (relação entre o<br />
último fechamento e o antece<strong>de</strong>nte) multiplicados entre si, calculando-se sua raiz<br />
<strong>de</strong> or<strong>de</strong>m “n”, subtraindo-se a uni<strong>da</strong><strong>de</strong> e multiplicando-se pela centena. Por<br />
exemplo:<br />
Ação A - U$ 120,00 para U$ 132,00 variação <strong>de</strong> 10% ou 1.1<br />
Ação B - U$ 60,00 para U$ 72,00 variação <strong>de</strong> 20% ou 1.2<br />
Ação C - U$ 200,00 para U$ 210,00 variação <strong>de</strong> 5% ou 1.05<br />
1.1 x 1.2 x 1.05 = 1.39<br />
1.39^3 1/x = 1,11<br />
1,11 - 1 x 100 = 11,49%<br />
A variação do <strong>índice</strong> calcula<strong>da</strong> pela média geométrica será <strong>de</strong> 11,49%,<br />
enquanto a variação pela média aritmética terá sido <strong>de</strong> 11,67% (10+20+5/3).<br />
Percebe-se que a variação geométrica é mais lenta que a aritmética. Para ilustrar<br />
melhor este fenômeno, vejamos a tabela abaixo, on<strong>de</strong> as várias probabili<strong>da</strong><strong>de</strong>s<br />
<strong>da</strong>s respectivas rentabili<strong>da</strong><strong>de</strong>s mantém inaltera<strong>da</strong> a média aritmética, embora<br />
alterem significativamente a média geométrica:<br />
Tabela 1 - EXEMPLO COMPARATIVO ENTRE VARIAÇÕES GEOMÉTRICA E ARITMÉTICA<br />
RENTABILIDADE VARIAÇÕES<br />
10% 20% 5%<br />
15% 20% 0%<br />
35% 0% 0%<br />
50% -5% -10%<br />
MA = (10 + 20 + 5 \ 3) = 11,67%<br />
MG = (1,1 x 1,2 x 1,05 = 1,39^3 1/x - 1 x 100) = 11,49%<br />
MA = (15 + 20 + 0 \ 3) = 11,67%<br />
MG = (1,5 x 1,2 x 1,0 = 1,38^3 1/x - 1 x 100) = 11,33%<br />
MA = (35 + 0 + 0 \ 3) = 11,67%<br />
MG = (1,35 x 1,0 x 1,0 = 1,35^3 1/x - 1 x 100) = 10,52%<br />
MA = (50 - 5 - 10 \ 3) = 11,67%<br />
MG = (1,5 x 0,95 x 0,90 = 1,28^3 1/x - 1 x 100) = 8,65%<br />
15