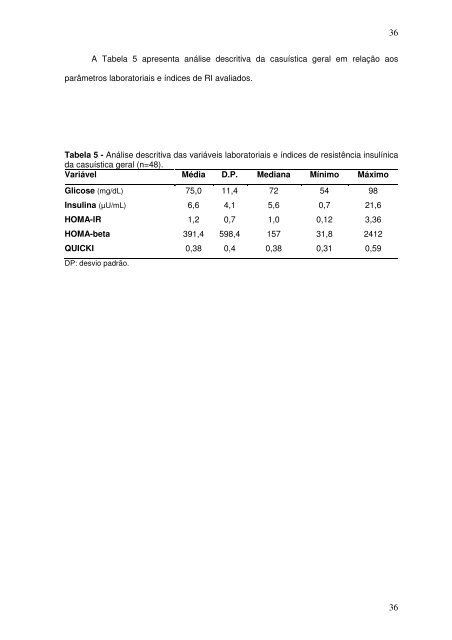
A Tabela 5 apresenta análise <strong>de</strong>scritiva <strong>da</strong> casuística geral em relação aos parâmetros laboratoriais e índices <strong>de</strong> RI avaliados. Tabela 5 - Análise <strong>de</strong>scritiva <strong>da</strong>s variáveis laboratoriais e índices <strong>de</strong> <strong>resistência</strong> <strong>insulínica</strong> <strong>da</strong> casuística geral (n=48). Variável Média D.P. Media<strong>na</strong> Mínimo Máximo Glicose (mg/dL) 75,0 11,4 72 54 98 Insuli<strong>na</strong> (µU/mL) 6,6 4,1 5,6 0,7 21,6 HOMA-IR 1,2 0,7 1,0 0,12 3,36 HOMA-beta 391,4 598,4 157 31,8 2412 QUICKI 0,38 0,4 0,38 0,31 0,59 DP: <strong>de</strong>svio padrão. 36 36
5.2 – Avaliação do perfil clínico e laboratorial <strong>da</strong> casuística, em relação ao peso ao <strong>na</strong>scer Estratificando as pacientes <strong>de</strong> acordo com a presença ou não <strong>de</strong> BPN observou- se que não houve diferença significativa <strong>na</strong>s variáveis clínicas, laboratoriais e nos índices <strong>de</strong> RI, conforme apresentado <strong>na</strong>s Tabelas 6 e 7. Tabela 6 - Análise <strong>de</strong>scritiva <strong>da</strong>s variáveis clínicas, segundo o baixo peso ao <strong>na</strong>scer <strong>na</strong> casuística geral. Baixo Variável Peso n Média DP Media<strong>na</strong> Mínimo Máximo p valor IMC (Kg/m 2 ) < 20 a sim 9 18,5 não 19 19,6 4,0 3,7 17,8 19,1 12,3 12,9 25,3 27 0,48 IMC (Kg/m 2 ) ≥ 20 a sim 5 23,1 não 15 22,8 4,2 3,2 24,5 21,7 15.5 18,4 25,8 29 0,57 Percentil IMC* sim 9 49,2 não 19 58,6 31,0 28,0 59,6 65,9 0,04 0,18 80,4 94,0 0,36 Z-score IMC* sim 9 -0,38 não 19 0,08 1,52 1,14 0,24 0,41 -3,34 -2,92 0,86 1,55 0,45 Cintura (cm) < 20 a sim 9 60,3 não 19 61,4 13,1 10,3 56 60 46,9 46 84,3 81,5 0,62 Cintura (cm) ≥ 20 a sim 5 76,6 não 15 70,7 8,2 6,07 77 69 66 62 88 85 0,16 Quadril** sim 5 90,8 não 15 87,3 8,8 9,5 94 88 76 72 99 104 0,27 RCQ** sim 5 0,848 0,077 não 15 0,815 0,065 0,820 0,810 0,770 0,720 0,970 0,940 0,36 n: número <strong>de</strong> pacientes; DP: <strong>de</strong>svio padrão; IMC: índice <strong>de</strong> massa corporal; RCQ: relação cintura/quadril; a: anos. * Percentil e Z-score do IMC foram calculados ape<strong>na</strong>s para pacientes ≤ 20 anos. ** Os valores <strong>de</strong> quadril e RCQ foram calculados ape<strong>na</strong>s para pacientes ≥ 20 anos. 37 37
- Page 1 and 2: Universidade Federal do Rio de Jane
- Page 3 and 4: 3 3
- Page 5 and 6: DEDICATÓRIA Ao Adilson, pelo amor
- Page 7 and 8: RESUMO AVALIAÇÃO DA RESISTÊNCIA
- Page 9 and 10: SUMÁRIO 2007 1 - INTRODUÇÃO.....
- Page 11 and 12: LISTA DE SIGLAS E ABREVIATURAS AMP
- Page 13 and 14: Tabela 14 - Análise descritiva das
- Page 15 and 16: 1 - INTRODUÇÃO A síndrome de Tur
- Page 17 and 18: gonadal é suficientemente grave pa
- Page 19 and 20: 2.2 - Resistência Insulínica - As
- Page 21 and 22: Acredita-se que o HOMA seja uma alt
- Page 23 and 24: 2.3 - Resistência Insulínica na s
- Page 25 and 26: 2.4 - Baixo Peso ao Nascer e Altera
- Page 27 and 28: Gale e cols. avaliaram homens e mul
- Page 29 and 30: 4 - PACIENTES E MÉTODOS 4.1 - Casu
- Page 31 and 32: As pacientes foram submetidas a pun
- Page 33 and 34: 3.3.2 para análise dos dados. O cr
- Page 35: A média do peso ao nascer na casu
- Page 39 and 40: 5.3 - Avaliação do perfil clínic
- Page 41 and 42: 5.4 - Avaliação do perfil laborat
- Page 43 and 44: 65 272 p=0,0002 Figura 3 - Valores
- Page 45 and 46: Tabela 12 - Análise estatística d
- Page 47 and 48: =0,127; p=0,39 Figura 4 - Dispersã
- Page 49 and 50: Percentil 90 2,33 HOMA-IR Figura 6
- Page 51 and 52: 43 o mosaicismo poderia justificar
- Page 53 and 54: de uso de GH nestas pacientes (9 no
- Page 55 and 56: adequado. A etiopatogenia da RI na
- Page 57 and 58: 8 - REFERÊNCIAS 1. Chromosome abno
- Page 59 and 60: 20. Manuel M, Katayama PK, Jones HW
- Page 61 and 62: 43. Cesaretti ML, Kohlmann Junior O
- Page 63 and 64: 62. Rasio E, Antaki A, Van Campenho
- Page 65 and 66: 85. Ibanez L, Jimenez R, de Zegher
- Page 67: metabolism, circulating adipokines,