of stream-sediment and heavy-mineral-concentrate samples Open ...
of stream-sediment and heavy-mineral-concentrate samples Open ...
of stream-sediment and heavy-mineral-concentrate samples Open ...

You also want an ePaper? Increase the reach of your titles
YUMPU automatically turns print PDFs into web optimized ePapers that Google loves.
Sarnpl e Analys i-s<br />
Spectrographic method<br />
. .<br />
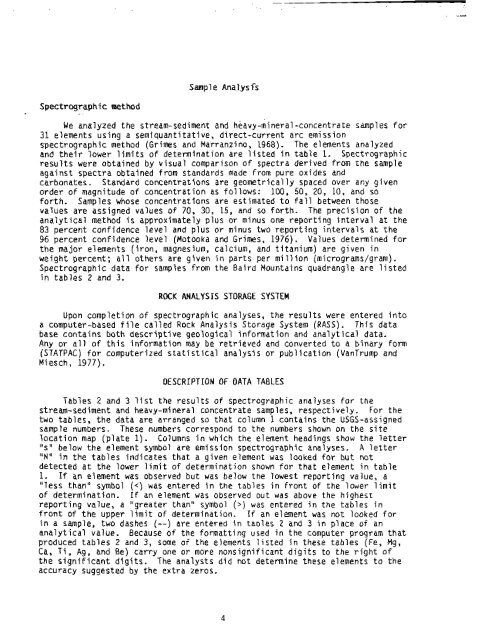
We analyzed the <strong>stream</strong>-<strong>sediment</strong> <strong>and</strong> <strong>heavy</strong>-<strong>mineral</strong>-<strong>concentrate</strong> <strong>samples</strong> for<br />
31 elements using a semiquanti tative, direct-current arc emission<br />
spectrographic method (Grimes <strong>and</strong> Marranzi no, 1968). The elements analyzed<br />
<strong>and</strong> their lower limits <strong>of</strong> determination are listed in table 1. Spectrographic<br />
results were obtained by visual comparison <strong>of</strong> spectra derived from the sample<br />
against spectra obtained from st<strong>and</strong>ards made from pure oxides <strong>and</strong><br />
carbonates. St<strong>and</strong>ard concentrations are geometrically spaced over any given<br />
order <strong>of</strong> magnitude <strong>of</strong> concentration as follows: 100, 50, 20, 10, <strong>and</strong> so<br />
forth. Samples whose concentrations are estimated to fall between those<br />
values are assigned values <strong>of</strong> 70, 30, 15, <strong>and</strong> so forth. The precision <strong>of</strong> the<br />
analytical method is approximately plus or minus one reporting interval at the<br />
83 percent confidence level <strong>and</strong> plus or minus two reporting intervals at the<br />
96 percent confidence level (Motooka <strong>and</strong> Grimes, 1976). Values determined for<br />
the major elements (iron, magnesium, calcium, <strong>and</strong> titanium) are given in<br />
weight percent; all others are given in parts per mi 11 ion (micrograms/gram).<br />
Spectrographic data for <strong>samples</strong> from the Baird Mountains quadrangle are listed<br />
in tables 2 <strong>and</strong> 3.<br />
ROCK ANALYSIS STORAGE SYSTEM<br />
Upon completion <strong>of</strong> spectrographic analyses, the results were entered into<br />
a computer-based f ile called Rock Analysis Storage System (RASS) . This data<br />
base contains both descriptive geological information <strong>and</strong> analytical data.<br />
Any or all <strong>of</strong> this information may be retrieved <strong>and</strong> converted to a binary form<br />
(STATPAC) for computerized statistical analysis or publication (VanTrump <strong>and</strong><br />
Mi esch, 1977).<br />
DESCRIPTION OF DATA TABLES<br />
Tables 2 <strong>and</strong> 3 list the results <strong>of</strong> spectrographic analyses for the<br />
<strong>stream</strong>-<strong>sediment</strong> <strong>and</strong> <strong>heavy</strong>-<strong>mineral</strong> <strong>concentrate</strong> <strong>samples</strong>, respectively. For the<br />
two tables, the data are arranged so that column 1 contains the USGS-assigned<br />
sample numbers. These numbers correspond to the numbers shown on the site<br />
location map (plate 1). Columns in which the element headings show the letter<br />
"s" below the element symbol are emission spectrographic analyses. A letter<br />
"N1' in the tables indicates that a given element was looked for but not<br />
detected at the lower limit <strong>of</strong> determination shown for that element in table<br />
1. If an element was observed but was below the lowest reporting value, a<br />
"less thann symbol () was entered in the tables in<br />
front <strong>of</strong> the upper limit <strong>of</strong> determination. If an element was not looked for<br />
in a sample, two dashes (--) are entered in taoles 2 <strong>and</strong> 3 in place <strong>of</strong> an<br />
analytical value. Because <strong>of</strong> the formatting used in the computer program that<br />
produced tables 2 <strong>and</strong> 3, some <strong>of</strong> the elements listed in these tables (Fe, Mg,<br />
Ca, Ti, Ag, <strong>and</strong> Be) carry one or more nonsignificant digits to the right <strong>of</strong><br />
the significant digits. The analysts did not determine these elements to the<br />
accuracy suggested by the extra zeros.