Download presentatie Roy Roelvink - Zestor
Download presentatie Roy Roelvink - Zestor Download presentatie Roy Roelvink - Zestor
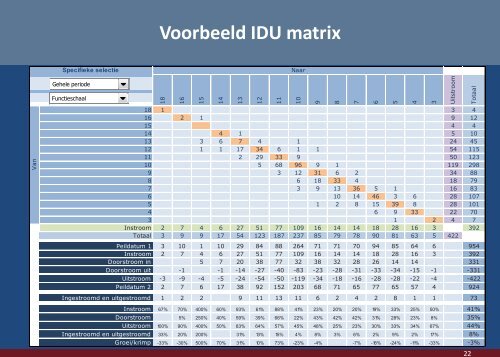
Van18161514131211109876543UitstroomTotaalVoorbeeld IDU matrixSpecifieke selectieSelectiemenu op basis van:Gehele periodeIDU op basis van:Functieschaal18161514131211109876543InstroomTotaal1 3 42 1 9 124 44 1 5 103 6 7 4 1 24 451 1 17 34 6 1 1 54 1152 29 33 9 50 1235 68 96 9 1 119 2983 12 31 6 2 34 886 18 33 4 18 793 9 13 36 5 1 16 8310 14 46 3 6 28 1071 2 8 15 39 8 28 1016 9 33 22 701 2 4 72 7 4 6 27 51 77 109 16 14 14 18 28 16 3 3923 9 9 17 54 123 187 237 85 79 78 90 81 63 5 422Peildatum 1 3 10 1 10 29 84 88 264 71 71 70 94 85 64 6 954Instroom 2 7 4 6 27 51 77 109 16 14 14 18 28 16 3 392Doorstroom in 5 7 20 38 77 32 38 32 28 26 14 14 331Doorstroom uit -1 -1 -14 -27 -40 -83 -23 -28 -31 -33 -34 -15 -1 -331Uitstroom -3 -9 -4 -5 -24 -54 -50 -119 -34 -18 -16 -28 -28 -22 -4 -422Peildatum 2 2-17-36517738992815264203-6168-371 65-577-1765-2057-74-2924Ingestroomd en uitgestroomd 1 2 2 9 11 13 11 6 2 4 2 8 1 1 73Instroom 67% 70% 400% 60% 93% 61% 88% 41% 23% 20% 20% 19% 33% 25% 50% 41%Doorstroom 5% 250% 40% 59% 39% 66% 22% 43% 42% 42% 31% 28% 23% 8% 35%Uitstroom 100% 90% 400% 50% 83% 64% 57% 45% 48% 25% 23% 30% 33% 34% 67% 44%Ingestroomd en uitgestroomd 33% 20% 200% 31% 13% 15% 4% 8% 3% 6% 2% 9% 2% 17% 8%Groei/krimp -33% -30% 500% 70% 31% 10% 73% -23% -4% -7% -18% -24% -11% -33% -3%Naar22
23Human Resource IntelligenceOndersteunt bij inzicht in de huidige situatie en operationalisatie vandoelstellingen, bijvoorbeeld:• Ontwikkeling aantal medewerkers / fte• Functiemix• % master en % gepromoveerd• Verdeling OP / OBP• Student / medewerker ratio’s• Vervangingsvraag• Verplichtingen vast en flexibel (in loondienst / niet in loondienst)• Ontwikkeling Gemiddelde PersoneelsLast (GPL)• Zicht op eigen kwaliteiten
- Page 1 and 2: Utrecht, april 2011Strategische Per
- Page 3 and 4: Leeftijdspiramide
- Page 5 and 6: Maar ook deze generatie...5
- Page 7 and 8: De nieuwe manager...7
- Page 9 and 10: 9Strategische personeelsplanning (S
- Page 11 and 12: 11Strategische personeelsplanningVR
- Page 13 and 14: 13SPP = K3RStrategische Personeelsp
- Page 15 and 16: ArbeidsrelatiesInternOverwerk, deel
- Page 17 and 18: Bindingsdashboard17
- Page 19 and 20: 19Ervaringen en vulkuilen1. SPP is
- Page 21: 21Human Resource Intelligence - Lmo
- Page 26: 26Roy RoelvinkOrganisatieadviseurDe
Van18161514131211109876543UitstroomTotaalVoorbeeld IDU matrixSpecifieke selectieSelectiemenu op basis van:Gehele periodeIDU op basis van:Functieschaal18161514131211109876543InstroomTotaal1 3 42 1 9 124 44 1 5 103 6 7 4 1 24 451 1 17 34 6 1 1 54 1152 29 33 9 50 1235 68 96 9 1 119 2983 12 31 6 2 34 886 18 33 4 18 793 9 13 36 5 1 16 8310 14 46 3 6 28 1071 2 8 15 39 8 28 1016 9 33 22 701 2 4 72 7 4 6 27 51 77 109 16 14 14 18 28 16 3 3923 9 9 17 54 123 187 237 85 79 78 90 81 63 5 422Peildatum 1 3 10 1 10 29 84 88 264 71 71 70 94 85 64 6 954Instroom 2 7 4 6 27 51 77 109 16 14 14 18 28 16 3 392Doorstroom in 5 7 20 38 77 32 38 32 28 26 14 14 331Doorstroom uit -1 -1 -14 -27 -40 -83 -23 -28 -31 -33 -34 -15 -1 -331Uitstroom -3 -9 -4 -5 -24 -54 -50 -119 -34 -18 -16 -28 -28 -22 -4 -422Peildatum 2 2-17-36517738992815264203-6168-371 65-577-1765-2057-74-2924Ingestroomd en uitgestroomd 1 2 2 9 11 13 11 6 2 4 2 8 1 1 73Instroom 67% 70% 400% 60% 93% 61% 88% 41% 23% 20% 20% 19% 33% 25% 50% 41%Doorstroom 5% 250% 40% 59% 39% 66% 22% 43% 42% 42% 31% 28% 23% 8% 35%Uitstroom 100% 90% 400% 50% 83% 64% 57% 45% 48% 25% 23% 30% 33% 34% 67% 44%Ingestroomd en uitgestroomd 33% 20% 200% 31% 13% 15% 4% 8% 3% 6% 2% 9% 2% 17% 8%Groei/krimp -33% -30% 500% 70% 31% 10% 73% -23% -4% -7% -18% -24% -11% -33% -3%Naar22


