Olst-Wijhe in cijfers 2012 - Gemeente Olst-Wijhe
Olst-Wijhe in cijfers 2012 - Gemeente Olst-Wijhe
Olst-Wijhe in cijfers 2012 - Gemeente Olst-Wijhe

Create successful ePaper yourself
Turn your PDF publications into a flip-book with our unique Google optimized e-Paper software.
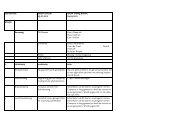
Tabel 34<br />
Won<strong>in</strong>gvoorraadmutaties naar oorzaken <strong>in</strong> <strong>Olst</strong>-<strong>Wijhe</strong><br />
Won<strong>in</strong>gvoorraad<br />
Mutatie- Adm. Won<strong>in</strong>gvoorraad<br />
Jaar op 1 januari Toevoeg<strong>in</strong>gen Onttrekk<strong>in</strong>gen saldo corr. op 31 december<br />
2003 6514 55 40 15 -2 6527<br />
2004 6527 70 9 61 -2 6586<br />
2005 6586 125 34 91 8 6685<br />
2006 6685 71 4 67 -28 6724<br />
2007 6724 55 21 34 37 6795<br />
2008 6795 124 15 109 16 6920<br />
2009 6920 60 11 49 1 6970<br />
2010 6970 58 55 3 -1 6972<br />
2011 6972 118 22 96 0 7068<br />
Bron: Centraal Bureau voor de Statistiek (C.B.S.)<br />
Tabel 35<br />
Woonruimtenvoorraad <strong>in</strong> <strong>Olst</strong>-<strong>Wijhe</strong>, 1 januari<br />
Capciteit bijzondere<br />
Jaar Won<strong>in</strong>gen Wooneenheden Recreatiewon<strong>in</strong>gen woongebouwen<br />
2003 6514 4 18 238<br />
2004 6527 4 43 238<br />
2005 6586 4 43 228<br />
2006 6685 54 239<br />
2007 6724 54 261<br />
2008 6795 4 52 261<br />
2009 6920 4 52 247<br />
2010 6970 4 52 247<br />
2011 6972 4 53 247<br />
Bron: Centraal Bureau voor de Statistiek (C.B.S.)<br />
- 57 -<br />
www.olst-wijhe.nl