Olst-Wijhe in cijfers 2012 - Gemeente Olst-Wijhe
Olst-Wijhe in cijfers 2012 - Gemeente Olst-Wijhe
Olst-Wijhe in cijfers 2012 - Gemeente Olst-Wijhe

Create successful ePaper yourself
Turn your PDF publications into a flip-book with our unique Google optimized e-Paper software.
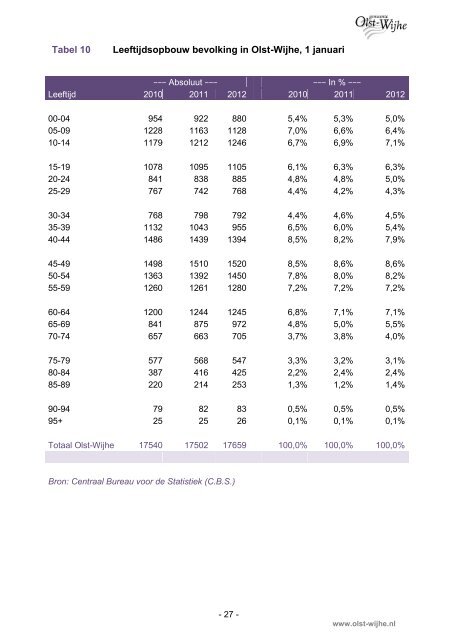
Tabel 10<br />
Leeftijdsopbouw bevolk<strong>in</strong>g <strong>in</strong> <strong>Olst</strong>-<strong>Wijhe</strong>, 1 januari<br />
−−− Absoluut −−−<br />
−−− In % −−−<br />
Leeftijd 2010 2011 <strong>2012</strong> 2010 2011 <strong>2012</strong><br />
00-04 954 922 880 5,4% 5,3% 5,0%<br />
05-09 1228 1163 1128 7,0% 6,6% 6,4%<br />
10-14 1179 1212 1246 6,7% 6,9% 7,1%<br />
15-19 1078 1095 1105 6,1% 6,3% 6,3%<br />
20-24 841 838 885 4,8% 4,8% 5,0%<br />
25-29 767 742 768 4,4% 4,2% 4,3%<br />
30-34 768 798 792 4,4% 4,6% 4,5%<br />
35-39 1132 1043 955 6,5% 6,0% 5,4%<br />
40-44 1486 1439 1394 8,5% 8,2% 7,9%<br />
45-49 1498 1510 1520 8,5% 8,6% 8,6%<br />
50-54 1363 1392 1450 7,8% 8,0% 8,2%<br />
55-59 1260 1261 1280 7,2% 7,2% 7,2%<br />
60-64 1200 1244 1245 6,8% 7,1% 7,1%<br />
65-69 841 875 972 4,8% 5,0% 5,5%<br />
70-74 657 663 705 3,7% 3,8% 4,0%<br />
75-79 577 568 547 3,3% 3,2% 3,1%<br />
80-84 387 416 425 2,2% 2,4% 2,4%<br />
85-89 220 214 253 1,3% 1,2% 1,4%<br />
90-94 79 82 83 0,5% 0,5% 0,5%<br />
95+ 25 25 26 0,1% 0,1% 0,1%<br />
Totaal <strong>Olst</strong>-<strong>Wijhe</strong> 17540 17502 17659 100,0% 100,0% 100,0%<br />
Bron: Centraal Bureau voor de Statistiek (C.B.S.)<br />
- 27 -<br />
www.olst-wijhe.nl