Geobrief 8 - kngmg
Geobrief 8 - kngmg
Geobrief 8 - kngmg

Create successful ePaper yourself
Turn your PDF publications into a flip-book with our unique Google optimized e-Paper software.
In liquid form, groundwater is the largest<br />
accessible source of freshwater. It serves<br />
as an essential source for drinking water<br />
and it supplies water for agricultural and<br />
industrial activities. During times of drought,<br />
groundwater has a crucial role to sustain<br />
water flow in rivers, lakes and wetlands<br />
(and thus supports ecosystem habitat and<br />
biodiversity), and its large natural storage<br />
provides a buffer against water shortage.<br />
Nevertheless, groundwater is known as a<br />
vulnerable resource. In many areas, ground-<br />
water is being consumed faster than it is<br />
naturally replenished. Due to climate<br />
change and increased human population,<br />
the pressure upon groundwater resources<br />
is expected to intensify. Hence, monitoring<br />
and predicting groundwater variability and<br />
change are imperative.<br />
Remote sensing<br />
However, assessing groundwater condition<br />
– especially over large areas – is difficult<br />
because it requires large amounts of groundbased<br />
measurement data. The most common<br />
way to measure groundwater states is by<br />
measuring groundwater head or level in a<br />
drilled observation well. Yet, in-situ head<br />
measurements are often sparsely distributed<br />
and the coverage of such head monitoring<br />
networks is mostly limited. Consequently,<br />
large-extent groundwater assessments (at<br />
the sub-continental scale and comprising<br />
multiple basins, aquifers and countries)<br />
are still challenging.<br />
During the last decades, spaceborne remote<br />
sensing applications for hydrological studies<br />
have received increased attention due to<br />
their ability to provide spatially and temporally<br />
exhaustive maps of hydrological properties.<br />
Examples include mapping of global<br />
land surface elevation (SRTM: Shuttle<br />
Radar Topography Mission), precipitation<br />
(TRMM: Tropical Rainfall Measuring Mission)<br />
and soil moisture (AMSR-E: Advanced<br />
Microwave Scanning Radiometer-EOS,<br />
SMOS: Soil Moisture and Ocean Salinity<br />
satellite), as well as global land surface<br />
temperature, vegetation and land cover<br />
(MODIS: Moderate-resolution Imaging<br />
Spectroradiometer). Yet, the use of satellitebased<br />
data in groundwater hydrology is still<br />
limited. Up to now, only the mission of<br />
GRACE (Gravity Recovery and Climate<br />
Experiment satellite) is recognized as a<br />
groundwater assessment tool, specifically<br />
to detect groundwater storage dynamics<br />
at a coarse resolution (400 km).<br />
Soil Water Index (SWI)<br />
In my Ph.D. research, we intend to explore<br />
the possibilities of using a satellite-based<br />
soil moisture product – having a better<br />
spatial resolution (50 km) than the GRACE<br />
product – for large-scale groundwater studies.<br />
In this research, we used the spatiotemporal<br />
maps of Soil Water Index (SWI) –<br />
derived by Vienna University of Technology<br />
(Austria), based on the scatterometer signals<br />
from European Remote Sensing (ERS)<br />
satellites. We used the monthly time series<br />
of SWI – which represents the moisture<br />
content of the upper profile soil (≤ 1 m<br />
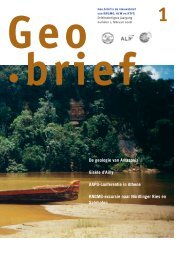
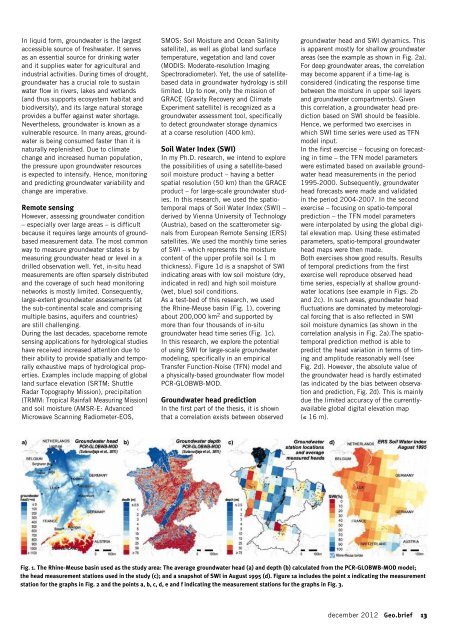
thickness). Figure 1d is a snapshot of SWI<br />
indicating areas with low soil moisture (dry,<br />
indicated in red) and high soil moisture<br />
(wet, blue) soil conditions.<br />
As a test-bed of this research, we used<br />
the Rhine-Meuse basin (Fig. 1), covering<br />
about 200,000 km 2 and supported by<br />
more than four thousands of in-situ<br />
groundwater head time series (Fig. 1c).<br />
In this research, we explore the potential<br />
of using SWI for large-scale groundwater<br />
modeling, specifically in an empirical<br />
Transfer Function-Noise (TFN) model and<br />
a physically-based groundwater flow model<br />
PCR-GLOBWB-MOD.<br />
Groundwater head prediction<br />
In the first part of the thesis, it is shown<br />
that a correlation exists between observed<br />
groundwater head and SWI dynamics. This<br />
is apparent mostly for shallow groundwater<br />
areas (see the example as shown in Fig. 2a).<br />
For deep groundwater areas, the correlation<br />
may become apparent if a time-lag is<br />
considered (indicating the response time<br />
between the moisture in upper soil layers<br />
and groundwater compartments). Given<br />
this correlation, a groundwater head prediction<br />
based on SWI should be feasible.<br />
Hence, we performed two exercises in<br />
which SWI time series were used as TFN<br />
model input.<br />
In the first exercise – focusing on forecasting<br />
in time – the TFN model parameters<br />
were estimated based on available groundwater<br />
head measurements in the period<br />
1995-2000. Subsequently, groundwater<br />
head forecasts were made and validated<br />
in the period 2004-2007. In the second<br />
exercise – focusing on spatio-temporal<br />
prediction – the TFN model parameters<br />
were interpolated by using the global digital<br />
elevation map. Using these estimated<br />
parameters, spatio-temporal groundwater<br />
head maps were then made.<br />
Both exercises show good results. Results<br />
of temporal predictions from the first<br />
exercise well reproduce observed head<br />
time series, especially at shallow groundwater<br />
locations (see example in Figs. 2b<br />
and 2c). In such areas, groundwater head<br />
fluctuations are dominated by meteorological<br />
forcing that is also reflected in SWI<br />
soil moisture dynamics (as shown in the<br />
correlation analysis in Fig. 2a).The spatiotemporal<br />
prediction method is able to<br />
predict the head variation in terms of timing<br />
and amplitude reasonably well (see<br />
Fig. 2d). However, the absolute value of<br />
the groundwater head is hardly estimated<br />
(as indicated by the bias between observation<br />
and prediction, Fig. 2d). This is mainly<br />
due the limited accuracy of the currentlyavailable<br />
global digital elevation map<br />
(≤ 16 m).<br />
Fig. 1. The Rhine-Meuse basin used as the study area: The average groundwater head (a) and depth (b) calculated from the PCR-GLOBWB-MOD model;<br />
the head measurement stations used in the study (c); and a snapshot of SWI in August 1995 (d). Figure 1a includes the point x indicating the measurement<br />
station for the graphs in Fig. 2 and the points a, b, c, d, e and f indicating the measurement stations for the graphs in Fig. 3.<br />
december 2012 Geo.brief 13