+ Download pdf (6.190 kb) - Nederlandse Commissie voor Geodesie
+ Download pdf (6.190 kb) - Nederlandse Commissie voor Geodesie
+ Download pdf (6.190 kb) - Nederlandse Commissie voor Geodesie
You also want an ePaper? Increase the reach of your titles
YUMPU automatically turns print PDFs into web optimized ePapers that Google loves.
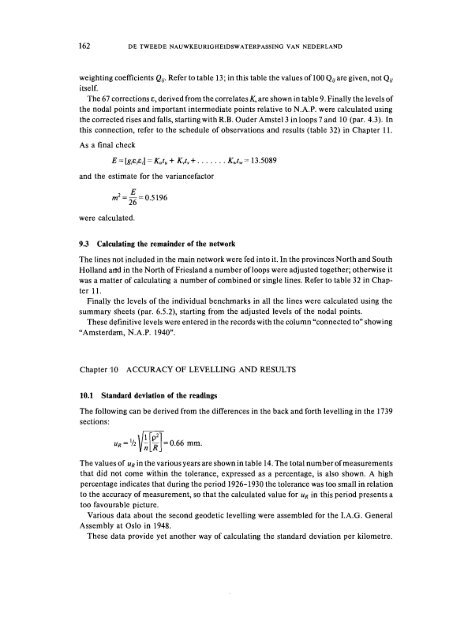
162 DE TWEEDE NAUWKEURlGHElDSWATERPASSING VAN NEDERLAND<br />
weighting coefficients Qp Refer to table 13; in this table the values of 100 Qv are given, not Qv<br />
itself.<br />
The 67 corrections E, derived from the correlates K, are shown in table 9. Finally the levels of<br />
the nodal points and important intermediate points relative to N.A.P. were calculated using<br />
the corrected rises and falls, starting with R.B. Ouder Amstel3 in loops 7 and 10 (par. 4.3). In<br />
this connection, refer to the schedule of observations and results (table 32) in Chapter 11.<br />
As a final check<br />
and the estimate for the variancefactor<br />
were calculated.<br />
9.3 Calculating the remainder of the network<br />
The lines not included in the main network were fed into it. In the provinces North and South<br />
Holland artd in the North of Friesland a number of loops were adjusted together; otherwise it<br />
was a matter of calculating a number of combined or single lines. Refer to table 32 in Chap-<br />
ter 11.<br />
Finally the levels of the individual benchmarks in all the lines were calculated using the<br />
summary sheets (par. 6.5.2), starting from the adjusted levels of the nodal points.<br />
These definitive levels were entered in the records with the column "connected to" showing<br />
"Amsterdam, N.A.P. 1940".<br />
Chapter .l0 ACCURACY OF LEVELLING AND RESULTS<br />
10.1 Standard deviation of the readings<br />
The following can be derived from the differences in the back and forth levelling in the 1739<br />
sections:<br />
im=<br />
U, = 'h 0.66 mm.<br />
The values of U, in the various years are shown in table 14. The total number of measurements<br />
that did not come within the tolerance, expressed as a percentage, is also shown. A high<br />
percentage indicates that during the period 1926-1930 the tolerance was too small in relation<br />
to the accuracy of measurement, so that the calculated value for U, in this period presents a<br />
too favourable picture.<br />
Various data about the second geodetic levelling were assembled for the I.A.G. General<br />
Assembly at Oslo in 1948.<br />
These data provide yet another way of calculating the standard deviation per kilometre.


