40 第四章 元素 每一类调色板下有若干种具体的实现,例如Blues是连续型调色板下的一 种,用以蓝色主题的渐变颜色: 1 > library(RColorBrewer) 2 > brewer.pal(9, "Blues") [1] "#F7FBFF" "#DEEBF7" "#C6DBEF" "#9ECAE1" "#6BAED6" "#4292C6" [7] "#2171B5" "#08519C" "#08306B" 所有调色板名称及其展示参见图4.1。 这些调色板并非一些简单的颜色 组合,而是有一定科学根据的。 例如离散型调色板下的颜色对大多数 人来说都有较好的区分度,甚至色盲也可以辨认其中不同类的颜色。 如果用户对颜色选取拿捏不准,不妨用这个包来生成颜色。 实际上这 个R包是一款叫ColorBrewer的产品的重新实现,更多信息可以访问网站 http://www.colorbrewer.org/。 4.1.4 渐变色的简单原理及应用 在此我们特别用一节来讲述“渐变色”,原因在于在图形中应用渐变色 往往能让图形看起来更美观、避免单调的颜色在图形中显得突兀。不难想 象,所谓“渐变”,也就是逐渐变化的意思,这种变化必然对应着某种单调 或非单调的(可导)函数,这些函数用来控制颜色值逐步变化。最简单的 例子莫过于线性函数:从一种颜色值到另一种颜色值线性变化。比如我们 在rgb()函数中用一元线性函数控制绿色在[0, 1]上的取值,同时将红色和 蓝色分别控制为1和0,那么我们将得到从纯红色到黄色的一个颜色渐变。 如: 1 > (x = rgb(1, seq(0, 1, length = 30), 0)) [1] "#FF0000" "#FF0900" "#FF1200" "#FF1A00" "#FF2300" "#FF2C00" [7] "#FF3500" "#FF3E00" "#FF4600" "#FF4F00" "#FF5800" "#FF6100" [13] "#FF6A00" "#FF7200" "#FF7B00" "#FF8400" "#FF8D00" "#FF9500" [19] "#FF9E00" "#FFA700" "#FFB000" "#FFB900" "#FFC100" "#FFCA00" [25] "#FFD300" "#FFDC00" "#FFE500" "#FFED00" "#FFF600" "#FFFF00" 1 > # 读者不妨用barplot(rep(1, 30), col = x)看看效果 显然本小节的内容与前一小节所讲到的调色板是一致的,只不过调色 板是预先配置好了的渐变色系列;我们在这里“重复”讲述渐变色的简单
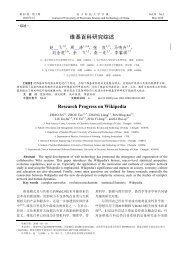
4.1 颜色 41 1 > layout(matrix(1:3, 3), heights = c(2, 1, 1)) 2 > par(mar = c(0, 4, 0, 0)) 3 > # 连续型:18种 4 > display.brewer.all(type = "seq") 5 > # 极端化:9种 6 > display.brewer.all(type = "div") 7 > # 离散型:8种 8 > display.brewer.all(type = "qual") YlOrRd YlOrBr YlGnBu YlGn Reds RdPu Purples PuRd PuBuGn PuBu OrRd Oranges Greys Greens GnBu BuPu BuGn Blues Spectral RdYlGn RdYlBu RdGy RdBu PuOr PRGn PiYG BrBG Set3 Set2 Set1 Pastel2 Pastel1 Paired Dark2 Accent 图 4.1: RColorBrewer包中所有调色板颜色的演示:从上至下依次是连续 型、极端化和离散型调色板。
- Page 1 and 2:
现代统计图形 谢益辉 2010
- Page 3 and 4:
• 自由软件用户往往有某
- Page 5 and 6:
目录 序言 i 代序一 . . . . .
- Page 7 and 8:
5.25 向日葵散点图 . . . . . .
- Page 9: 附录 B 作图技巧 163 B.1 添
- Page 12 and 13: 5.4 泊松分布随机数茎叶图
- Page 15 and 16: 表格 5.1 二维列联表的经典
- Page 17 and 18: 序言 代序一 代序二 作者
- Page 19: Coefficients: Estimate Std. Error t
- Page 22 and 23: 2 第一章 历史 图 1.1: Playfai
- Page 24 and 25: 4 第一章 历史 吸到了“瘴
- Page 26 and 27: 6 第一章 历史 图 1.4: 南丁
- Page 28 and 29: 8 第一章 历史 图 1.5: Minard
- Page 30 and 31: 10 第一章 历史 总的说来,
- Page 32 and 33: 12 第二章 工具 大小,如条
- Page 34 and 35: 14 第二章 工具 Type contributo
- Page 36 and 37: 16 第二章 工具 百K的一个
- Page 38 and 39: 18 第二章 工具 其实没有必
- Page 40 and 41: 20 第二章 工具
- Page 42 and 43: 22 第三章 细节 3.1 par()函数
- Page 44 and 45: 24 第三章 细节 1:10 2 4 6 8 10
- Page 46 and 47: 26 第三章 细节 las 坐标轴
- Page 48 and 49: 28 第三章 细节 oma[2] mar[2] O
- Page 50 and 51: 30 第三章 细节 3.2 plot()及
- Page 52 and 53: 32 第三章 细节 xlim, ylim 设
- Page 54 and 55: 34 第四章 元素 4.1 颜色 默
- Page 56 and 57: 36 第四章 元素 4.1.2 颜色生
- Page 58 and 59: 38 第四章 元素 [,1] [,2] [,3]
- Page 62 and 63: 42 第四章 元素 1 > xx = c(1912
- Page 64 and 65: 44 第四章 元素 0 1 2 3 4 5 6 7
- Page 66 and 67: 46 第四章 元素 图2.1已经使
- Page 68 and 69: 48 第四章 元素 1 > usage(arrow
- Page 70 and 71: 50 第四章 元素 一个多边形
- Page 72 and 73: 52 第四章 元素 可以看到,
- Page 74 and 75: 54 第四章 元素 1 > par(mar = c
- Page 76 and 77: 56 第四章 元素 1 > data(Export
- Page 78 and 79: 58 第四章 元素 12 72.48 2003 U
- Page 80 and 81: 60 第五章 图库 1 > par(mfrow =
- Page 82 and 83: 62 第五章 图库 f(x) = F ′ F
- Page 84 and 85: 64 第五章 图库 1 > stem(island
- Page 86 and 87: 66 第五章 图库 对原始数据
- Page 88 and 89: 68 第五章 图库 names, plot = T
- Page 90 and 91: 70 第五章 图库 1 > par(mar = c
- Page 92 and 93: 72 第五章 图库 1 > # 用分类
- Page 94: 74 第五章 图库 1 > library(MSG
- Page 97 and 98: 5.7 条件密度图 77 R中关联
- Page 99 and 100: 5.7 条件密度图 79 小到大在
- Page 101 and 102: 5.8 等高图 81 1 > data(ChinaLife
- Page 103 and 104: 5.8 等高图 83 都必须展示在
- Page 105 and 106: 5.9 条件分割图 85 1 > par(mar
- Page 107 and 108: 5.10 一元函数曲线图 87 1 > c
- Page 109 and 110: 5.12 颜色等高图 89 1 > dotchar
- Page 111 and 112:
5.13 四瓣图 91 finite = TRUE), y
- Page 113 and 114:
5.13 四瓣图 93 表 5.1: 二维
- Page 115 and 116:
5.14 颜色图 95 C和E系的优比
- Page 117 and 118:
5.14 颜色图 97 1 > par(mar = rep
- Page 119 and 120:
5.15 矩阵图 99 1 > sines = outer
- Page 121 and 122:
5.16 马赛克图 101 1 > ftable(Ti
- Page 123 and 124:
5.17 散点图矩阵 103 较低。
- Page 125 and 126:
5.18 三维透视图 105 倍数;fon
- Page 127 and 128:
5.18 三维透视图 107 Sinc( r )
- Page 129 and 130:
5.19 因素效应图 109 1 > plot.d
- Page 131 and 132:
5.21 平滑散点图 111 1 > par(ma
- Page 133 and 134:
5.22 棘状图 113 可将图5.28放
- Page 135 and 136:
5.22 棘状图 115 离散化处理,
- Page 137 and 138:
5.23 星状图 117 1 > # 预设调
- Page 139 and 140:
5.24 带状图 119 1 > layout(matri
- Page 141 and 142:
5.25 向日葵散点图 121 1 > sun
- Page 143 and 144:
5.26 符号图 123 1 > par(mar = c(
- Page 145:
5.27 饼图 125 增长率 总人口
- Page 148 and 149:
128 第五章 图库 种以比例
- Page 150 and 151:
130 第五章 图库 1 > # 真实
- Page 152 and 153:
132 第五章 图库 信用风险
- Page 154 and 155:
134 第五章 图库 1 > library(rp
- Page 156 and 157:
136 第五章 图库 有时候与
- Page 158 and 159:
138 第五章 图库 数诸如填
- Page 160 and 161:
140 第五章 图库
- Page 162 and 163:
142 第六章 系统 8 > plot(0:1,
- Page 164 and 165:
144 第七章 模型 • 类似回
- Page 166 and 167:
146 第七章 模型 7.16.1 分类
- Page 168 and 169:
148 第八章 数据 8.2.1 一维
- Page 170 and 171:
150 附录 A 程序初步 通常我
- Page 172 and 173:
152 附录 A 程序初步 1 > # 冒
- Page 174 and 175:
154 附录 A 程序初步 [1] 1 2 3
- Page 176 and 177:
156 附录 A 程序初步 [,1] [,2]
- Page 178 and 179:
158 附录 A 程序初步 A.1.5 函
- Page 180 and 181:
160 附录 A 程序初步 [1] "inte
- Page 182 and 183:
162 附录 A 程序初步 2. 变量
- Page 184 and 185:
164 附录 B 作图技巧 1 > # 本
- Page 186 and 187:
166 附录 B 作图技巧 1 > layou
- Page 188 and 189:
168 附录 B 作图技巧 screen(n
- Page 190 and 191:
170 附录 B 作图技巧 B.3 交
- Page 192 and 193:
172 附录 B 作图技巧 1 > xx =
- Page 194 and 195:
174 附录 B 作图技巧 正的频
- Page 196 and 197:
176 附录 B 作图技巧
- Page 198 and 199:
178 附录 C 统计动画
- Page 200 and 201:
180 附录 D 本书R包 D.2 数据
- Page 202 and 203:
182 参考文献 Minka , URL http:/
- Page 204 and 205:
184 参考文献 Meyer D, Zeileis A
- Page 206 and 207:
186 参考文献 Wilkinson L (2005)
- Page 208 and 209:
188 索引 点, 27 玫瑰图, 4 直
- Page 210:
190 索引 形的一些历史,包