现代统计图形 - 科学网—博客
现代统计图形 - 科学网—博客
现代统计图形 - 科学网—博客

Create successful ePaper yourself
Turn your PDF publications into a flip-book with our unique Google optimized e-Paper software.
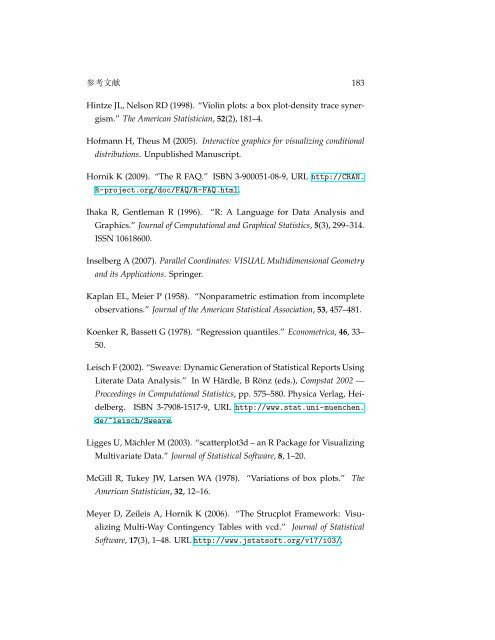
参考文献 183<br />
Hintze JL, Nelson RD (1998). “Violin plots: a box plot-density trace syner-<br />
gism.” The American Statistician, 52(2), 181–4.<br />
Hofmann H, Theus M (2005). Interactive graphics for visualizing conditional<br />
distributions. Unpublished Manuscript.<br />
Hornik K (2009). “The R FAQ.” ISBN 3-900051-08-9, URL http://CRAN.<br />
R-project.org/doc/FAQ/R-FAQ.html.<br />
Ihaka R, Gentleman R (1996). “R: A Language for Data Analysis and<br />
Graphics.” Journal of Computational and Graphical Statistics, 5(3), 299–314.<br />
ISSN 10618600.<br />
Inselberg A (2007). Parallel Coordinates: VISUAL Multidimensional Geometry<br />
and its Applications. Springer.<br />
Kaplan EL, Meier P (1958). “Nonparametric estimation from incomplete<br />
observations.” Journal of the American Statistical Association, 53, 457–481.<br />
Koenker R, Bassett G (1978). “Regression quantiles.” Econometrica, 46, 33–<br />
50.<br />
Leisch F (2002). “Sweave: Dynamic Generation of Statistical Reports Using<br />
Literate Data Analysis.” In W Härdle, B Rönz (eds.), Compstat 2002 —<br />
Proceedings in Computational Statistics, pp. 575–580. Physica Verlag, Hei-<br />
delberg. ISBN 3-7908-1517-9, URL http://www.stat.uni-muenchen.<br />
de/~leisch/Sweave.<br />
Ligges U, Mächler M (2003). “scatterplot3d – an R Package for Visualizing<br />
Multivariate Data.” Journal of Statistical Software, 8, 1–20.<br />
McGill R, Tukey JW, Larsen WA (1978). “Variations of box plots.” The<br />
American Statistician, 32, 12–16.<br />
Meyer D, Zeileis A, Hornik K (2006). “The Strucplot Framework: Visu-<br />
alizing Multi-Way Contingency Tables with vcd.” Journal of Statistical<br />
Software, 17(3), 1–48. URL http://www.jstatsoft.org/v17/i03/.