现代统计图形 - 科学网—博客
现代统计图形 - 科学网—博客
现代统计图形 - 科学网—博客

Create successful ePaper yourself
Turn your PDF publications into a flip-book with our unique Google optimized e-Paper software.
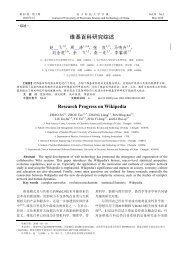
5.25 向日葵散点图 121<br />
1 > sunflowerplot(iris[, 3:4], col = "gold", seg.col = "gold")<br />
Petal.Width<br />
0.5 1.0 1.5 2.0 2.5<br />
1 2 3 4 5 6 7<br />
Petal.Length<br />
图 5.32: 鸢尾花花瓣长和宽的向日葵散点图<br />
R中向日葵散点图的函数为sunflowerplot(),其用法如下:<br />
1 > usage(sunflowerplot)<br />
sunflowerplot(x, y = NULL, number, log = "",<br />
digits = 6, xlab = NULL, ylab = NULL, xlim = NULL,<br />
ylim = NULL, add = FALSE, rotate = FALSE, pch = 16,<br />
cex = 0.8, cex.fact = 1.5, col = par("col"), bg = NA,<br />
size = 1/8, seg.col = 2, seg.lwd = 1.5, ...)<br />
x和y分别为散点图的两个变量;number为人工给定的数据频数,即<br />
图中的花瓣数目,若不指定这个参数的话R会自动从x和y计算;digits给<br />
定数值的有效数字位数,在计算重复数据之前原始数据会按照digits四舍<br />
五入;add决定是否将向日葵散点图添加到当前图形上;rotate决定是否<br />
随机旋转向日葵的角度;pch给定散点图的点的类型;cex给定散点图的<br />
点的缩放倍数;cex.fact给定向日葵中心点的缩小倍数,真正的缩放倍数<br />
为cex/cex.fact;col为散点的颜色,bg为点的背景色;size为向日葵花瓣<br />
的长度,单位为英寸;seg.col为花瓣的颜色;seg.lwd为花瓣的宽度。