现代统计图形 - 科学网—博客
现代统计图形 - 科学网—博客
现代统计图形 - 科学网—博客

Create successful ePaper yourself
Turn your PDF publications into a flip-book with our unique Google optimized e-Paper software.
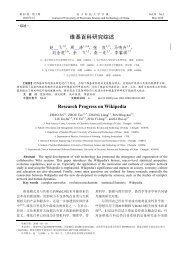
5.9 条件分割图 85<br />
1 > par(mar = rep(0, 4), mgp = c(2, 0.5, 0))<br />
2 > library(maps)<br />
3 > coplot(lat ~ long | depth, data = quakes, number = 4,<br />
4 + ylim = c(-45, -10.72), panel = function(x, y,<br />
5 + ...) {<br />
6 + map("world2", regions = c("New Zealand",<br />
7 + "Fiji"), add = TRUE, lwd = 0.1, fill = TRUE,<br />
8 + col = "lightgray")<br />
9 + text(180, -13, "Fiji", adj = 1)<br />
10 + text(170, -35, "NZ")<br />
11 + points(x, y, col = rgb(0.2, 0.2, 0.2, 0.5))<br />
12 + })<br />
lat<br />
-45 -35 -25 -15<br />
165 170 175 180 185<br />
NZ<br />
NZ<br />
Fiji<br />
Fiji<br />
Given : depth<br />
100 200 300 400 500 600<br />
NZ<br />
NZ<br />
Fiji<br />
Fiji<br />
165 170 175 180 185<br />
long<br />
图 5.14: 给定震源深图的地震经纬度条件分割图:四幅散点图有相同的坐标<br />
系,震源深度按左下、右下、左上、右上的顺序逐渐增加,可以看到地震<br />
发生地点逐渐在向斐济岛靠近。<br />
-45 -35 -25 -15