现代统计图形 - 科学网—博客
现代统计图形 - 科学网—博客
现代统计图形 - 科学网—博客

Create successful ePaper yourself
Turn your PDF publications into a flip-book with our unique Google optimized e-Paper software.
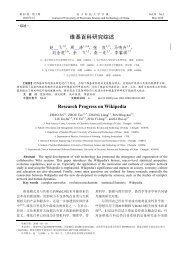
5.8 等高图 81<br />
1 > data(ChinaLifeEdu)<br />
2 > x = ChinaLifeEdu<br />
3 > plot(0, 0, type = "n", xlim = range(x[, 1]), ylim = range(x[,<br />
4 + 2]), xlab = "预期寿命", ylab = "高学历人数")<br />
5 > u = par("usr")<br />
6 > rect(u[1], u[3], u[2], u[4], col = "antiquewhite",<br />
7 + border = "red")<br />
8 > library(KernSmooth)<br />
9 > est = bkde2D(x, apply(x, 2, dpik))<br />
10 > contour(est$x1, est$x2, est$fhat, nlevels = 15, col = "darkgreen",<br />
11 + add = TRUE, vfont = c("sans serif", "plain"))<br />
12 > points(x)<br />
高学历人数<br />
0 10000 20000 30000 40000 50000 60000<br />
64 66 68 70 72 74 76 78<br />
预期寿命<br />
图 5.12: 2005年中国31地区国民预期寿命和高学历人数密度等高图