ETHYLENE PRODUCTION / SENSITIVITY CHART
ETHYLENE PRODUCTION / SENSITIVITY CHART ETHYLENE PRODUCTION / SENSITIVITY CHART
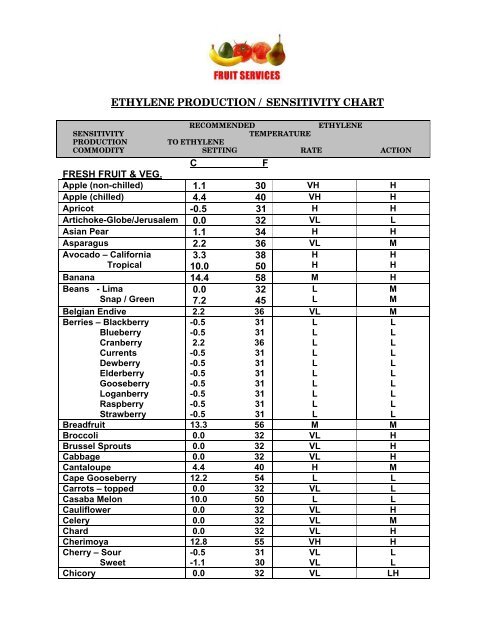
Spinach 0.0 32 VL HSquash – Hard Skin12.0 54LLSoft Skin10.0 50LMSummer7.2 45LMZucchini7.2 45NNN = NONE L = LOW H = HIGHVL = VERY LOW M = MEDIUM VH = VERY HIGH<strong>SENSITIVITY</strong><strong>PRODUCTION</strong><strong>ETHYLENE</strong> <strong>PRODUCTION</strong> / <strong>SENSITIVITY</strong> <strong>CHART</strong>RECOMMENDEDTEMPERATURETO <strong>ETHYLENE</strong><strong>ETHYLENE</strong>COMMODITY SETTING RATE ACTIONC FFRESH FRUIT & VEG.Star Fruit 8.9 48 L LSwede (Rutabaga) 0.0 32 VL LSweet Corn 0.0 32 VL LSweet Potato 13.3 56 VL LTamarillo 0.0 32 L MTangerine 7.2 45 VL MTaro Root 7.2 45 N NTomato – Mature / Green 13.3 56 VLHBrkr / Lt. Pink 10.0 50 MHTree – Tomato 3.9 39 H MTurnip – Roots0.0 32 VLLGreens0.0 32 VLHWatercress 0.0 32 VL HWatermelon 10.0 50 L HYam 13.3 56 VL LLive PlantsCut Flowers – RosesChrysanthemumsGladioliCarnations0.0 320.0 322.2 360.0 32VLVLVLVLPotted Plants -2.8-18.3 27/65 VL HNursery Stock -1.1/4.4 30/40 VL HChristmas Trees 0.0 32 N NFlower Bulbs – Bulbs /Corns/Rhizomes / Tubers7.2/15 45/59 VL HHHHH


