Excel Chapter 1 Test.pdf
Excel Chapter 1 Test.pdf Excel Chapter 1 Test.pdf
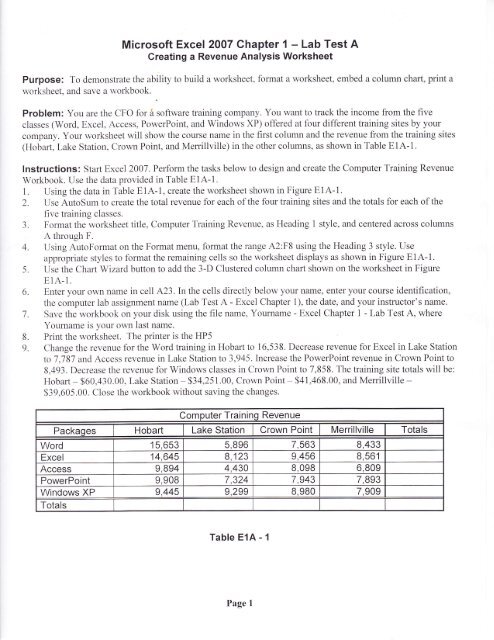
Microsoft Excel 2007 Ghapter 1 - Lab Test ACreating a Revenue Analysis WorksheetPurpose: To demonstrate the ability to build a worksheet" format a worksheet, embed a column chaft, print awolksheet, and save a workbook..Problem: You are the CFO for 6 software training company. You want to track the income from the fiveclasses (Word, Excel. Access, PowerPoint, and Windows XP) offered at four different training sites by yourcompany. Your worksheet will show the course name in the first column and the revenue from the training sites(Hobart, Lake Station, Crown Point, and Merrillville) in the other columns, as shown in Table E1A-1.lnstructions: Starl Excel 2007. Perform the tasks below to design and create the Computer Training RevenueWorkbook. Use the data provided in Table ElA-1.1. Using the data in Table E1A-1, create the worksheet shown in Figure E1A-1.2. Use AutoSum to create the total revenue for each of the four training sites and the totals for each of thefive training classes.3. Format the worksheet title, Computer Training Revenue, as Heading 1 style, and centered across columnsA through F.4. Using AutoFormat on the Format menu, format the range A2:F8 using the Heading 3 style. Useapplopriate styles to format the remaining cells so the worksheet displays as shown in Figure E1A-1.5. Use the Chart Wizard button to add the 3-D Clustered column chart shown on the worksheet in FigureElA-1.6. Enter your own name in cell A23.Inthe cells directly below your name, enter your course identification,the computer lab assignment name (Lab Test A - Excel Chapter 1), the date, and your instructor's name.l. Save the workbook on your disk using the file name, Yourname - Excel Chapter 1 - Lab Test A, whereYourname is your own last name.8. Print the worksheet. The printer is the HP59. Change the revenue for the Word training in Hobart to 16,538. Decrease revenue for Excel in Lake Stationto 7,78J and Access revenue in Lake Station to 3,945.Increase the PowerPoint revenue in Crown Point to8.493. Decrease the revenue fol Windows classes in Crown Point to 7,858. The training site totals will be:Hobart - $60,430.00, Lake Station - $34,251.00, Crown Point $41,468.00, and Merrillville -$39,605.00. Close the workbook without saving the changes.Computer Training RevenuePackaqes Hobart Lake Station Crown Point Merrillville TotalsWord 15,653 5,896 7,563 8,433Excel 14,645 8,123 9,456 8,561Access 9,894 4,430 8,098 6,809PowerPoint 9,908 7,324 7,943 7,893Windows XP 9,445 9,299 8,980 7,909TotalsTable ElA - 1Page I
Microsoft <strong>Excel</strong> 2007 Ghapter 1 - Lab <strong>Test</strong> ACreating a Revenue Analysis WorksheetPurpose: To demonstrate the ability to build a worksheet" format a worksheet, embed a column chaft, print awolksheet, and save a workbook..Problem: You are the CFO for 6 software training company. You want to track the income from the fiveclasses (Word, <strong>Excel</strong>. Access, PowerPoint, and Windows XP) offered at four different training sites by yourcompany. Your worksheet will show the course name in the first column and the revenue from the training sites(Hobart, Lake Station, Crown Point, and Merrillville) in the other columns, as shown in Table E1A-1.lnstructions: Starl <strong>Excel</strong> 2007. Perform the tasks below to design and create the Computer Training RevenueWorkbook. Use the data provided in Table ElA-1.1. Using the data in Table E1A-1, create the worksheet shown in Figure E1A-1.2. Use AutoSum to create the total revenue for each of the four training sites and the totals for each of thefive training classes.3. Format the worksheet title, Computer Training Revenue, as Heading 1 style, and centered across columnsA through F.4. Using AutoFormat on the Format menu, format the range A2:F8 using the Heading 3 style. Useapplopriate styles to format the remaining cells so the worksheet displays as shown in Figure E1A-1.5. Use the Chart Wizard button to add the 3-D Clustered column chart shown on the worksheet in FigureElA-1.6. Enter your own name in cell A23.Inthe cells directly below your name, enter your course identification,the computer lab assignment name (Lab <strong>Test</strong> A - <strong>Excel</strong> <strong>Chapter</strong> 1), the date, and your instructor's name.l. Save the workbook on your disk using the file name, Yourname - <strong>Excel</strong> <strong>Chapter</strong> 1 - Lab <strong>Test</strong> A, whereYourname is your own last name.8. Print the worksheet. The printer is the HP59. Change the revenue for the Word training in Hobart to 16,538. Decrease revenue for <strong>Excel</strong> in Lake Stationto 7,78J and Access revenue in Lake Station to 3,945.Increase the PowerPoint revenue in Crown Point to8.493. Decrease the revenue fol Windows classes in Crown Point to 7,858. The training site totals will be:Hobart - $60,430.00, Lake Station - $34,251.00, Crown Point $41,468.00, and Merrillville -$39,605.00. Close the workbook without saving the changes.Computer Training RevenuePackaqes Hobart Lake Station Crown Point Merrillville TotalsWord 15,653 5,896 7,563 8,433<strong>Excel</strong> 14,645 8,123 9,456 8,561Access 9,894 4,430 8,098 6,809PowerPoint 9,908 7,324 7,943 7,893Windows XP 9,445 9,299 8,980 7,909TotalsTable ElA - 1Page I


