Piano Speciali Allegati - Provincia di Pistoia
Piano Speciali Allegati - Provincia di Pistoia
Piano Speciali Allegati - Provincia di Pistoia

You also want an ePaper? Increase the reach of your titles
YUMPU automatically turns print PDFs into web optimized ePapers that Google loves.
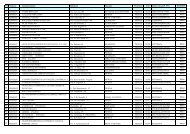
Tabella 14 Produzione <strong>di</strong>chiarata PCB per Comune anni 2003, 2004, 2005 e 2006<br />
COMUNI<br />
Insieme alla produzione <strong>di</strong> PCB, per ogni Comune, è anche specificata l’incidenza<br />
percentuale della produzione <strong>di</strong>chiarata rispetto ai relativi totali provinciali.<br />
Analizzando i livelli <strong>di</strong> produzione, appare evidente come la quantità più elevata <strong>di</strong> PCB,<br />
sia stata prodotta nei Comuni <strong>di</strong> Firenze e Barberino Val D’Elsa.<br />
Produzione <strong>di</strong> PCB <strong>di</strong>chiarata per comparti economici (ATECO 2002)<br />
Risulta interessante anche verificare quali sono i comparti <strong>di</strong> rilievo per la produzione <strong>di</strong><br />
rifiuti contenenti PCB. Nella seguente tabella si evidenziano le attività economiche che<br />
negli ultimi quattro anni <strong>di</strong>sponibili hanno <strong>di</strong>chiarato produzioni <strong>di</strong> PCB, per ogni gruppo <strong>di</strong><br />
attività economica viene in<strong>di</strong>cata la produzione in percentuale rispetto alla produzione<br />
totale dell’anno.<br />
Tabella 15. Produzione <strong>di</strong>chiarata per attività economica. Anni 2003, 2004, 2005 e 2006<br />
ATECO<br />
2002<br />
90.0<br />
40.1<br />
DESCRIZIONE<br />
Smaltimento dei rifiuti soli<strong>di</strong>, delle<br />
acque <strong>di</strong> scarico e simili<br />
Produzione e <strong>di</strong>stribuzione energia<br />
elettrica<br />
2003 2003 2004 2004 2005 2005 2006 2006<br />
(T/A) (%) (T/A) (%) (T/A) (%) (T/A) (%)<br />
184,8 67,5% 267,9 89,3% 64,89 29,5% - -<br />
24,61 9,02% 10,56 3,52% 115,5 52,6% 49,5 65,7%<br />
23.201 Raffinerie <strong>di</strong> petrolio 23,36 8,56% - - - - - -<br />
41001<br />
PCB<br />
2003<br />
(T/A)<br />
PCB<br />
2003<br />
(%)<br />
Captazione, adduzione, depurazione<br />
e <strong>di</strong>stribuzione d’acqua potabile<br />
PCB<br />
2004<br />
(T/A)<br />
PCB<br />
2004<br />
(%)<br />
15, 5,8<br />
PCB<br />
2005<br />
(T/A)<br />
PCB<br />
2005<br />
(%)<br />
PCB<br />
2006<br />
(T/A)<br />
PCB<br />
2006<br />
(%)<br />
Firenze 37,5 13,7% 7,31 2,4% 159,1 72,4% 47,9 63,6%<br />
Barberino Val D’Elsa 183,8 67,4% 267,9 89,3% - - 2,8 3,7%<br />
Calenzano 18,2 6,7% - - - - - -<br />
Empoli 7,95 2,9% - - 12,9 5,9% 12,3 16,3%<br />
Greve in Chianti - - 7,8 2,6% - - - -<br />
Impruneta - - 6,18 2,05% 20,22 9,2% 2,3 3,1%<br />
Pontassieve - - - - 12,15 5,5% 4,0 5,3%<br />
Scarperia - - - - 8,57 3,9% - -<br />
SUBTOTALE 247,4 90,7% 289,2 96,4% 193,6 88,1% 69.3 97%<br />
TOTALE 272,7 100% 300,1 100% 219,6 100% 71.4 100%<br />
- - - - - -<br />
60.1 Trasporti ferroviari 9,07 3,32% - - 13,82 6,29% 10,9 14,4%<br />
45211 Lavori generali <strong>di</strong> costruzioni <strong>di</strong> e<strong>di</strong>fici - - - - 7,36 3,35% 2,2 2,9%<br />
100