Annual Report 2004 - Georgian Stock Exchange
Annual Report 2004 - Georgian Stock Exchange
Annual Report 2004 - Georgian Stock Exchange

You also want an ePaper? Increase the reach of your titles
YUMPU automatically turns print PDFs into web optimized ePapers that Google loves.
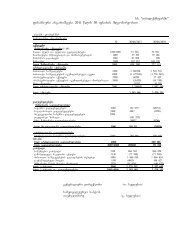
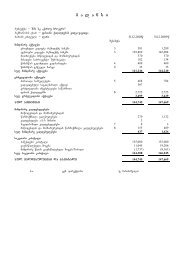
vaWrobis statistika<br />
savaWrod gamotanili fuli, lari 72,1 mln<br />
fuladi saxsrebis realizacia 64,73%<br />
ZiriTadi maCveneblebi<br />
savaWrod gamotanili fasiani q.<br />
1 373 mln.<br />
fasiani qaRaldebis realizacia 2,22%<br />
ssb-is savaWro sistemaSi <strong>2004</strong> wlis ganmavlobaSi<br />
savaWrod gamotanili iyo 72,1 mln. lari da 1 373 mln.<br />
aqcia, xolo garigebebis saxiT realizebuli iyo<br />
aRniSnuli Tanxis 64,73%, xolo aqciebis - 2,22%.<br />
wevrebis uzrunvelyofis angariSebidan realizebuli<br />
fasiani qaRaldebi da fuladi saxsrebi wlebis<br />
mixedviT warmodgenilia cxr. 4-Si.<br />
3 4<br />
<strong>2004</strong> wlis vaWrobis ZiriTadi maCveneblebi<br />
kvartlebis mixedviT /<br />
Y<strong>2004</strong> Trade Indicators by Quarter<br />
<strong>2004</strong> wlis vaWrobis ZiriTadi maCveneblebi<br />
Tveebis mixedviT /<br />
Y<strong>2004</strong> Trade Indicators by Month<br />
garigebebis raodenoba<br />
number of trades<br />
25%<br />
3%<br />
17%<br />
14.00<br />
12.00<br />
garigebebis<br />
Rirebuleba (lari)<br />
trades value (GEL)<br />
33%<br />
13% 13%<br />
36%<br />
38%<br />
33%<br />
29%<br />
mkn., GEL<br />
10.00<br />
8.00<br />
6.00<br />
31%<br />
4.00<br />
garigebebis moculoba<br />
(f/q)<br />
trades value (securities)<br />
29%<br />
2.00<br />
0.00<br />
1 2 3 4 5 6 7 8 9 10 11 12<br />
Q1 Q2 Q3 Q4<br />
Y2000 Y2002 Y<strong>2004</strong><br />
Y2001<br />
Y2003<br />
4 <strong>2004</strong> wels uzrunvelyofis angariSebze Caricxuli aqtivebis realizacia<br />
Realization of Assets Transferred on the Trading System Security Accounts<br />
Rirebuleba (lari) / value (GEL)<br />
moculoba (f/q) / volume (sec.)<br />
aqtivebi<br />
assets<br />
garigebebi<br />
trades<br />
realizacia<br />
realization<br />
aqtivebi<br />
assets<br />
garigebebi<br />
trades<br />
realizacia<br />
realization<br />
Y<strong>2004</strong> 72,103,506.91 46,676,153.46 64.73% 1,373,388,816 30,510,783 2.22%<br />
Y2003 2,519,535.24 1,735,289.77 68.87% 1,277,941,903 7,903,864 0.62%<br />
Y2002 9,401,298.23 8,411,353.70 89.47% 824,777,933 11,454,842 1.39%<br />
Y2001 29,153,451.54 13,077,244.49 44.86% 109,468,929 10,862,784 9.92%<br />
Y2000 8,670,563.45 5,892,325.83 67.96% 16,699,620 4,354,640 26.08%<br />
wliuri angariSi <strong>2004</strong><br />
ss saqarTvelos safondo birJa<br />
ss saqarTvelos fasiani qaRaldebis centraluri depozitari<br />
13