Annual Report 2004 - Georgian Stock Exchange
Annual Report 2004 - Georgian Stock Exchange
Annual Report 2004 - Georgian Stock Exchange

You also want an ePaper? Increase the reach of your titles
YUMPU automatically turns print PDFs into web optimized ePapers that Google loves.
Trade Statistics<br />
Basic Data on Trades<br />
Funds submitted for trading, GEL<br />
72.1 mln<br />
Realization of funds 64.73%<br />
Securities submitted for trading<br />
1,373 mln.<br />
Realization of shares 2.22%<br />
In the year of <strong>2004</strong>, GEL72.1ml. and 1,373 ml. shares<br />
were placed for trading at the GSE trading system<br />
out of which 64.73% of these funds and 2.22% of the<br />
shares were realized. Table 4 shows the securities and<br />
funds realized from the GSE members' security<br />
accounts by years.<br />
2<br />
<strong>2004</strong> wlis vaWrobis ZiriTadi maCveneblebis dinamika / Y<strong>2004</strong> Main Trades Indicators Trends<br />
Tve/month 1 2 3 4 5 6 7 8 9<br />
1 3,053,050 482,633.01 36 8 60,329.13 381,631.25 5 84,807 13,406.47<br />
2 660,714 736,992.50 73 8 92,124.06 82,589.25 9 9,051 10,095.79<br />
3 142,328 73,109.95 81 9 8,123.33 15,814.22 9 1,757 902.59<br />
Q1 3,856,092 1,292,735.46 190 25 51,709.42 154,243.68 8 20,295 6,803.87<br />
4 2,800,181 1,071,911.58 88 9 119,101.29 311,131.22 10 31,820 12,180.81<br />
5 784,913 840,446.94 77 8 105,055.87 98,114.13 10 10,194 10,914.90<br />
6 7,404,545 13,451,461.73 150 9 1,494,606.86 822,727.22 17 49,364 89,676.41<br />
Q2 10,989,639 15,363,820.25 315 26 590,916.16 422,678.42 12 34,888 48,774.03<br />
7 6,599,960 5,025,991.75 172 9 558,443.53 733,328.89 19 38,372 29,220.88<br />
8 4,830,408 8,851,871.73 81 9 983,541.30 536,712.00 9 59,635 109,282.37<br />
9 162,350 507,507.22 61 9 56,389.69 18,038.89 7 2,661 8,319.79<br />
Q3 11,592,718 14,385,370.70 314 27 532,791.51 429,359.93 12 36,919 45,813.28<br />
10 1,700,060 6,725,204.99 51 7 960,743.57 242,865.71 7 33,335 131,866.76<br />
*11 1,931,964 7,960,248.73 109 8 995,031.09 241,495.50 14 17,724 73,029.80<br />
12 440,310 948,773.33 115 9 105,419.26 48,923.33 13 3,829 8,250.20<br />
Q4 4,072,334 15,634,227.05 275 24 651,426.13 169,680.58 11 14,808 56,851.73<br />
Y<strong>2004</strong> 30,510,783 46,676,153.46 1,094 102 457,609.35 299,125.32 11 27,889 42,665.59<br />
Y2003 7,903,864 1,735,289.77 913 100 17,352.90 79,038.64 9 8,657 1,900.65<br />
Y2002 11,454,842 8,411,353.70 1,347 102 82,464.25 112,302.37 13 8,504 6,244.51<br />
Y2001 10,862,784 13,077,244.49 1,591 102 128,208.00 106,497.88 16 6,828 8,219.51<br />
Y2000 4,354,640 5,892,325.83 601 80 73,654.00 54,433.00 8 7,246 9,804.20<br />
*maTSorisarasabirJogarigebebisregistracia / include large OTC trades registration<br />
523,516 261,758.00<br />
1 moculoba (f/q) / volume (securities)<br />
2 Rirebuleba (lari) / value (GEL)<br />
3 garigebebis raodenoba / number of trades<br />
4 savaWro dReebis raodenoba / number of trading days<br />
5 saS. dRiuri brunva (lari) / avarage daily turnover (GEL)<br />
6 saS. dRiuri moculoba (f/q) / avarage daily volume (securities)<br />
7 saSualod garigeba dReSi / avarage trades per day<br />
8 erTi garigebis saSualo moculoba / avarage volume of trade<br />
9 erTi garigebis saSualo Rirebuleba / avarage value of trade<br />
ANNUAL REPORT <strong>2004</strong><br />
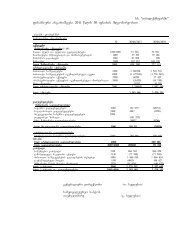
3 <strong>2004</strong> wels savaWro sistemaSi Setanili ganacxadebi / Orders entered in the Trading System during <strong>2004</strong><br />
moculoba (f/q)<br />
volume (sec.)<br />
realizacia<br />
realization<br />
Rirebuleba (lari)<br />
value (GEL)<br />
realizacia<br />
realization<br />
gan. raodenoba<br />
num. of orders<br />
realizacia<br />
realization<br />
gayidva / sell 68,238,504 44.71% 76,248,840.32 61.22% 1,194 91.62%<br />
Sesyidva / buy 31,688,507 96.28% 59,892,914.04 77.93% 1,473 74.27%<br />
12 <strong>Georgian</strong> <strong>Stock</strong> <strong>Exchange</strong> JSC<br />
<strong>Georgian</strong> Central Securities Depository JSC