- Page 1 and 2: d u e m i l a q u a t t r o RAPPORT
- Page 3 and 4: ASSESSORATO ALL’AMBIENTE Assessor
- Page 5 and 6: SEZIONE B TEMATISMI AMBIENTALI pagi
- Page 7 and 8: SEZIONE C SPESE AMBIENTALI, PIANI F
- Page 9 and 10: gramma di rottamazione dei motorini
- Page 11 and 12: ne della spesa per l'ambiente. Il R
- Page 13: Arpalazio ha sviluppato negli ultim
- Page 16 and 17: CONTRIBUTI E RINGRAZIAMENTI L’att
- Page 18 and 19: Il Gruppo di Lavoro “Suolo” ha
- Page 20 and 21: 1. METODOLOGIA 1.1. DEFINIZIONE Il
- Page 22 and 23: Si riportano di seguito i principal
- Page 24 and 25: 1.3.4 GLI 1.3.4 INDICATORI GLI INDI
- Page 26 and 27: 2. INQUADRAMENTO TERRITORIALE Il te
- Page 29 and 30: SEZIONE A DETERMINANTI
- Page 31 and 32: Il bilancio demografico 2002 è car
- Page 33 and 34: TEMA INDICATORE DINAMICHE DELLA POP
- Page 35 and 36: TEMA INDICATORE DINAMICHE DELLA POP
- Page 37 and 38: TEMA INDICATORE DINAMICHE DELLA POP
- Page 39 and 40: TEMA INDICATORE DINAMICHE DELLA POP
- Page 41 and 42: Per quanto attiene alle singole pro
- Page 43 and 44: determinato da alcune caratteristic
- Page 45 and 46: 4.3. 4.3. GLI INDICATORI Tema Siste
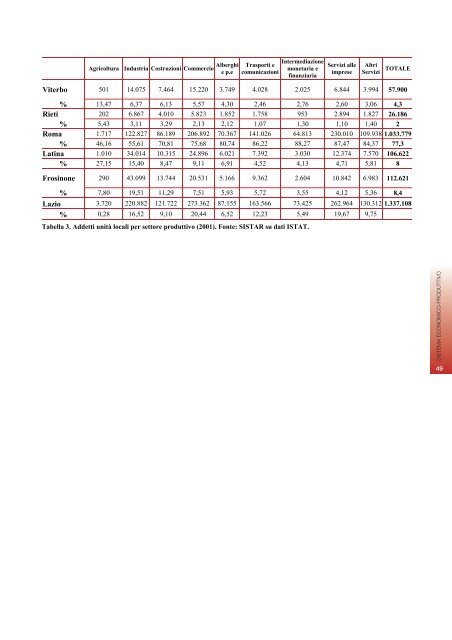
- Page 47: Per quanto riguarda la distribuzion
- Page 51 and 52: TEMA INDICATORE SISTEMA ECONOMICO-P
- Page 53 and 54: TEMA INDICATORE SISTEMA ECONOMICO-P
- Page 55 and 56: SCHEDA 1 Riferimenti normativi dell
- Page 57 and 58: all'allegato i al d.m. 23/11/2001,
- Page 59 and 60: % Regione Lazio e Italia - Tasso di
- Page 61 and 62: Le aziende agricole con superficie
- Page 63 and 64: Azione F.7 “Gestione dei sistemi
- Page 65 and 66: Azioni Non specificata Tipologie di
- Page 67 and 68: TEMA INDICATORE AGRICOLTURA AZIENDE
- Page 69 and 70: TEMA INDICATORE AGRICOLTURA VENDITA
- Page 71 and 72: TEMA INDICATORE AGRICOLTURA VENDITA
- Page 73 and 74: TEMA INDICATORE AGRICOLTURA ORGANIS
- Page 75 and 76: Ciliegio (Prunus avium x P. pseudoc
- Page 77 and 78: Le produzioni di qualità riguardan
- Page 79 and 80: 6.2. 6.2. LE LE PRINCIPALI EVIDENZE
- Page 81 and 82: "Attuazione della direttiva n. 98/3
- Page 83 and 84: SCHEDA 2 Gli strumenti del Piano En
- Page 85 and 86: delle esperienze già da tempo in a
- Page 87 and 88: TEMA INDICATORE ENERGIA PRODUZIONE
- Page 89 and 90: Tale produzione è attualmente gara
- Page 91 and 92: TEMA INDICATORE ENERGIA CONSUMI FIN
- Page 93 and 94: Consumi finali di energia pro-capit
- Page 95 and 96: Calabria 0,1% 65,4% 12,9% 0,7% 21,0
- Page 97 and 98: Regioni Agricoltura Industria Resid
- Page 99 and 100:
Nel 2001 i consumi energetici compl
- Page 101 and 102:
TEMA INDICATORE ENERGIA BILANCIO EN
- Page 103 and 104:
I porti principali del Lazio sono s
- Page 105 and 106:
TEMA INDICATORE TRASPORTI E INFRAST
- Page 107 and 108:
TEMA INDICATORE TRASPORTI E INFRAST
- Page 109 and 110:
% 80,0 Regione Lazio - Tasso di mot
- Page 111 and 112:
Treni-km anno 16.900.000 Treni/gior
- Page 113 and 114:
Questo trend trova riscontro anche
- Page 115 and 116:
- Progetti per il potenziamento del
- Page 117 and 118:
TEMA INDICATORE TURISMO ARRIVI E PR
- Page 119 and 120:
Regione Lazio - Presenze italiani e
- Page 121 and 122:
TEMA INDICATORE TURISMO PERMANENZA
- Page 123 and 124:
TEMA INDICATORE TURISMO ESERCIZI AL
- Page 125 and 126:
TEMA INDICATORE TURISMO ARRIVI E PR
- Page 127 and 128:
Regione Lazio - Alloggi agrituristi
- Page 129:
129
- Page 132 and 133:
9. ATMOSFERA ATMOSFERA 132 9.1 VALU
- Page 134 and 135:
Variazione % del numero di superame
- Page 136 and 137:
Il sistema industriale del Lazio, c
- Page 138 and 139:
1b 1 2 Z1 Comuni nei quali almeno u
- Page 140 and 141:
SCHEDA 1 Il quadro normativo La pia
- Page 142 and 143:
SCHEDA 2 Servizio Agrometeorologico
- Page 144 and 145:
9.3 GLI INDICATORI 9.3.1 LO STATO 9
- Page 146 and 147:
Roma Civitavecchia 0 0 0 0 0 0 Roma
- Page 148 and 149:
Inquinante Parametro di riferimento
- Page 150 and 151:
TEMA INDICATORE ATMOSFERA - QUALITA
- Page 152 and 153:
PM 10 - Confronto n° superamenti D
- Page 154 and 155:
Inquinante Parametro di riferimento
- Page 156 and 157:
TEMA INDICATORE ATMOSFERA - QUALITA
- Page 158 and 159:
TEMA INDICATORE ATMOSFERA - QUALITA
- Page 160 and 161:
SCHEDA 3 La rete di monitoraggio di
- Page 162 and 163:
Le stazioni di misura della rete so
- Page 164 and 165:
9.3.2 LE DETERMINANTI, LE PRESSIONI
- Page 166 and 167:
Nella stima della regione Lazio sul
- Page 168 and 169:
TEMA INDICATORE ATMOSFERA - EMISSIO
- Page 170 and 171:
TEMA INDICATORE ATMOSFERA - EMISSIO
- Page 172 and 173:
TEMA INDICATORE ATMOSFERA - EMISSIO
- Page 174 and 175:
TEMA INDICATORE ATMOSFERA - EMISSIO
- Page 176 and 177:
A Monte Rufeno le deposizioni ammon
- Page 178 and 179:
10. IDROSFERA 10.1 VALUTAZIONE SINT
- Page 180 and 181:
La qualità delle acque destinate a
- Page 182 and 183:
10.3 GLI INDICATORI 10.3.1 LO STATO
- Page 184 and 185:
ACQUE SOTTERRANEE La qualità ambie
- Page 186 and 187:
SACA: Stato Ambientale dei Corsi d
- Page 188 and 189:
TEMA INDICATORE IDROSFERA - QUALIT
- Page 190 and 191:
La valutazione della qualità chimi
- Page 192 and 193:
IDROSFERA 192 CANALE DEI PESCATORI
- Page 194 and 195:
TEMA INDICATORE IDROSFERA - QUALIT
- Page 196 and 197:
Dai valori dell’indice SECA emerg
- Page 198 and 199:
SCHEDA 3 L’inquinamento delle acq
- Page 200 and 201:
TEMA INDICATORE IDROSFERA - QUALIT
- Page 202 and 203:
TEMA INDICATORE IDROSFERA - QUALIT
- Page 204 and 205:
TEMA INDICATORE IDROSFERA - QUALIT
- Page 206 and 207:
SCHEDA 5 La flora algale del Lazio
- Page 208 and 209:
10.3.1.4 QUALITÀ 10.3.1.4 DELLE Qu
- Page 210 and 211:
LATINA Sabaudia 3000 metri 1 LATINA
- Page 212 and 213:
10.3.2 LE DETERMINANTI, LE PRESSION
- Page 214 and 215:
TEMA INDICATORE IDROSFERA - EMISSIO
- Page 216 and 217:
TEMA INDICATORE IDROSFERA - EMISSIO
- Page 218 and 219:
10.3.2.2 USO 10.3.2.2 DELLA RISORSA
- Page 220 and 221:
TEMA INDICATORE IDROSFERA - USO DEL
- Page 222 and 223:
L’analisi colturale su base provi
- Page 224 and 225:
10.3.3 LE 10.3.3 RISPOSTE LE RISPOS
- Page 226 and 227:
Obiettivi di qualità delle acque s
- Page 228 and 229:
L’efficienza depurativa sopra ind
- Page 230 and 231:
Nell’Accordo è inoltre previsto
- Page 232 and 233:
N° abitanti equivalenti non Provin
- Page 234 and 235:
TEMA INDICATORE IDROSFERA - RISPOST
- Page 236 and 237:
TEMA INDICATORE IDROSFERA - RISPOST
- Page 238 and 239:
11. GEOSFERA GEOSFERA 238 11.1 VALU
- Page 240 and 241:
La provincia di Frosinone appare il
- Page 242 and 243:
Negli ultimi 14 anni sono stati avv
- Page 244 and 245:
11.3 GLI INDICATORI 11.3.1 LO STATO
- Page 246 and 247:
Fortunatamente l’esame degli anda
- Page 248 and 249:
TEMA INDICATORE GEOSFERA - CARATTER
- Page 250 and 251:
SCHEDA 1 La carta dei suoli di Leon
- Page 252 and 253:
TEMA INDICATORE GEOSFERA - RISCHIO
- Page 254 and 255:
Gaeta- Garigliano Isole Ponziane Ga
- Page 256 and 257:
TEMA INDICATORE GEOSFERA - RISCHIO
- Page 258 and 259:
TEMA INDICATORE GEOSFERA - RISCHIO
- Page 260 and 261:
TEMA INDICATORE GEOSFERA - RISCHIO
- Page 262 and 263:
Figura 5. Litologia del Lazio e ris
- Page 264 and 265:
TEMA INDICATORE GEOSFERA - RISCHIO
- Page 266 and 267:
Provincia Stabilimento chimico o pe
- Page 268 and 269:
Parallelamente le aziende petrolife
- Page 270 and 271:
locchetti sono formazioni piroclast
- Page 272 and 273:
TEMA INDICATORE GEOSFERA - RISPOSTE
- Page 274 and 275:
Province N° interventi In progetta
- Page 276 and 277:
Oltre agli interventi sopra citati,
- Page 278 and 279:
Le azioni regionali nel campo della
- Page 280 and 281:
Alcuni di questi piani erano stati
- Page 282 and 283:
Nel Lazio, dal 1985 al 1999, si è
- Page 284 and 285:
TEMA INDICATORE GEOSFERA SITI BONIF
- Page 286 and 287:
Celleno Discarica Vignanello Discar
- Page 288 and 289:
precedentemente compresi nella zona
- Page 290 and 291:
BIBLIOGRAFIA ESSENZIALE APAT, 2004
- Page 292 and 293:
12.2 12.2LE LE PRINCIPALI EVIDENZE
- Page 294 and 295:
2003) che il valore medio nazionale
- Page 296 and 297:
Successivamente, in seguito alla di
- Page 298 and 299:
Razionalizzazione nell’impiego de
- Page 300 and 301:
SCHEDA 4 La gestione della Sezione
- Page 302 and 303:
TEMA INDICATORE RIFIUTI - PRODUZION
- Page 304 and 305:
TEMA INDICATORE RIFIUTI - PRODUZION
- Page 306 and 307:
La produzione pro-capite di rifiuti
- Page 308 and 309:
Le cause di questo aumento si posso
- Page 310 and 311:
Gruppo CER Frosinone Latina Rieti R
- Page 312 and 313:
Gruppo CER Frosinone Latina Rieti R
- Page 314 and 315:
Se si guarda al rapporto tra produz
- Page 316 and 317:
Volume apparecchi contenenti PCB Co
- Page 318 and 319:
12.3.2 LA 12.3.2 GESTIONE LA GESTIO
- Page 320 and 321:
Nel calcolo non sono stati consider
- Page 322 and 323:
inizialmente proveniente da Regioni
- Page 324 and 325:
TEMA INDICATORE RIFIUTI - GESTIONE
- Page 326 and 327:
TEMA INDICATORE RIFIUTI - GESTIONE
- Page 328 and 329:
Regione Lazio - Raccolta per veicol
- Page 330 and 331:
milioni di tonnellate l’anno) a s
- Page 332 and 333:
Dei 10 impianti di smaltimento dei
- Page 334 and 335:
Sigla Tipologia Quantità recuperat
- Page 336 and 337:
337
- Page 338 and 339:
Le onde elettromagnetiche, rapprese
- Page 340 and 341:
obiettivi di qualità, stabiliti un
- Page 342 and 343:
13.3 GLI INDICATORI 13.3.1 LO STATO
- Page 344 and 345:
TEMA INDICATORE RADIAZIONI NON IONI
- Page 346 and 347:
TEMA INDICATORE RADIAZIONI NON IONI
- Page 348 and 349:
Regione Lazio - Impianti e siti per
- Page 350 and 351:
TEMA INDICATORE RADIAZIONI NON IONI
- Page 352 and 353:
TEMA INDICATORE RADIAZIONI NON IONI
- Page 354 and 355:
TEMA INDICATORE RADIAZIONI NON IONI
- Page 356 and 357:
357
- Page 358 and 359:
14.214.2LE PRINCIPALI EVIDENZE L’
- Page 360 and 361:
Oltre a queste vi sono sorgenti di
- Page 362 and 363:
tratti nelle zona B. Lo stesso si p
- Page 364 and 365:
14.3 GLI INDICATORI 14.3.1 LO STATO
- Page 366 and 367:
N. sorgenti controllate per cui si
- Page 368 and 369:
(Tabella 4). A Roma e Rieti, invece
- Page 370 and 371:
SCHEDA 3 Popolazione esposta ad ele
- Page 372 and 373:
TEMA INDICATORE RUMORE TRAFFICO FER
- Page 374 and 375:
espansioni delle curve di isolivell
- Page 376 and 377:
14.3.3 LE 14.3.3 RISPOSTE LE RISPOS
- Page 378 and 379:
Regione Lazio - Numero di comuni co
- Page 380 and 381:
Finanziamenti alle aree protette Le
- Page 382 and 383:
La superficie forestale regionale o
- Page 384 and 385:
A fronte della presenza sul territo
- Page 386 and 387:
15.3 GLI INDICATORI 15.3.1 LO STATO
- Page 388 and 389:
EX = Estinto: non presente nel Lazi
- Page 390 and 391:
Sono 68 le specie laziali considera
- Page 392 and 393:
SCHEDA 1 La fauna da salvare Tra le
- Page 394 and 395:
seguito ad incidenti stradali. Anch
- Page 396 and 397:
Lago di Nazzano (tratto fiume Tever
- Page 398 and 399:
Classe Specie Nome comune Pesci Sal
- Page 400 and 401:
IL GRANCHIO DI FIUME (POTAMON FLUVI
- Page 402 and 403:
tonnellate, che rappresentano più
- Page 404 and 405:
Dall’esame dei dati emerge che 53
- Page 406 and 407:
Ben 78 entità sono da considerarsi
- Page 408 and 409:
TEMA INDICATORE BIOSFERA - BIODIVER
- Page 410 and 411:
TEMA INDICATORE BIOSFERA - AREE PRO
- Page 412 and 413:
Regione Lazio - % di territorio pro
- Page 414 and 415:
km 2 ) e il Lago di Vico (12,270 km
- Page 416 and 417:
in uno stato di conservazione soddi
- Page 418 and 419:
TEMA INDICATORE BIOSFERA - AREE PRO
- Page 420 and 421:
Abruzzo 4 288.408 26,6% Calabria 4
- Page 422 and 423:
14 4060 Lande alpine e boreali 14 8
- Page 424 and 425:
Valutazione globale pSIC N° pSIC A
- Page 426 and 427:
TEMA INDICATORE BIOSFERA - PAESAGGI
- Page 428 and 429:
Regione Lazio - Geositi all'interno
- Page 430 and 431:
Il territorio della città di Roma,
- Page 432 and 433:
TEMA INDICATORE BIOSFERA - PAESAGGI
- Page 434 and 435:
TEMA INDICATORE BIOSFERA - PAESAGGI
- Page 436 and 437:
Codice Descrizione Area (ha) % Terr
- Page 438 and 439:
superfici occupate dai vigneti e da
- Page 440 and 441:
TEMA INDICATORE BIOSFERA - FORESTE
- Page 442 and 443:
15.3.2 LE DETERMINANTI, LE PRESSION
- Page 444 and 445:
Cacciatori 1996/1997 ha ATC/ caccia
- Page 446 and 447:
TEMA INDICATORE BIOSFERA - PRESSION
- Page 448 and 449:
TEMA INDICATORE BIOSFERA - PRESSION
- Page 450 and 451:
TEMA INDICATORE BIOSFERA - PRESSION
- Page 452 and 453:
Sono sempre i mesi estivi quelli ma
- Page 454 and 455:
TEMA INDICATORE BIOSFERA - RISPOSTE
- Page 456 and 457:
Rete ecologica, 5 interventi in for
- Page 458 and 459:
- creazione di corridoi ecologici;
- Page 460 and 461:
TEMA INDICATORE BIOSFERA - RISPOSTE
- Page 462 and 463:
Regione Lazio - Superfici interessa
- Page 464 and 465:
Il numero più elevato di controlli
- Page 466 and 467:
BONIFAZI ET AL. (in corso di stampa
- Page 468:
469
- Page 471 and 472:
16. LE SPESE PER LA TUTELA DELL’A
- Page 473 and 474:
- al primo stadio, ci si è avvalsi
- Page 475 and 476:
Per quanto riguarda la distribuzion
- Page 477 and 478:
16.2 16.2LE LE SPESE AMBIENTALI DEL
- Page 479 and 480:
LE SPESE PER LA TUTELA DELL’AMBIE
- Page 481 and 482:
Alcuni termini di finanza pubblica
- Page 483 and 484:
destinatari sono i Comuni cui media
- Page 485 and 486:
della regione di interventi per la
- Page 487 and 488:
(ai quali vengono destinati l’8%
- Page 489 and 490:
50 45 40 35 30 25 20 15 10 5 - 1995
- Page 491 and 492:
100% Gestione delle acque reflue (C
- Page 493 and 494:
16.2.4 TAVOLE 16.2.4 TAVOLE STATIST
- Page 495 and 496:
LE SPESE PER LA TUTELA DELL’AMBIE
- Page 497 and 498:
LE SPESE PER LA TUTELA DELL’AMBIE
- Page 499 and 500:
16.2.5 BIBLIOGRAFIA 16.2.5 BIBLIOGR
- Page 501 and 502:
Assi Prioritari Annualità Spesa Pu
- Page 503 and 504:
LA PROGRAMMAZIONE REGIONALE DEI PRI
- Page 505 and 506:
APQ8 sulle risorse idriche APQ8 sul
- Page 507 and 508:
18. 17. I I PROGRAMMI DI DI INFORMA
- Page 509 and 510:
18.2.1 I 18.2.1 LABORATORI I LABORA
- Page 511 and 512:
messa a punto di un sistema di indi
- Page 513 and 514:
I PROGRAMMI DI INFORMAZIONE ED EDUC
- Page 515 and 516:
SEZIONE C SPESE AMBIENTALI, PIANI F
- Page 517 and 518:
mere spese di gestione. Si è mante
- Page 519 and 520:
2003 rispetto a quelle rilevate dal
- Page 521 and 522:
Inquinamento luminoso 0,08% Tutela
- Page 523 and 524:
Scheda 1. Nota metodologica: defini
- Page 525 and 526:
6. protezione della biodiversità e
- Page 527 and 528:
• i capitoli di spesa a finalità
- Page 529 and 530:
400.000 350.000 300.000 250.000 200
- Page 531 and 532:
160.000 140.000 120.000 100.000 80.
- Page 533 and 534:
60.000 50.000 40.000 30.000 20.000
- Page 535 and 536:
interventi diretti in questo settor
- Page 537 and 538:
100% Protezione della biodiversità
- Page 539 and 540:
Settori di intervento con riferimen
- Page 541 and 542:
Settori di intervento con riferimen
- Page 543 and 544:
Settori di intervento con riferimen
- Page 545 and 546:
17. 16. LA LA PROGRAMMAZIONE REGION
- Page 547 and 548:
Assi Prioritari Annualità Spesa Pu
- Page 549 and 550:
L’APQ8, stante l’articolazione
- Page 551 and 552:
Azione I.1.2 “Conservazione e inc
- Page 553 and 554:
si è pervenuti al varo nel luglio
- Page 555 and 556:
- nelle Aree Protette regionali, co
- Page 557 and 558:
Figura 3. La struttura della Banca
- Page 559 and 560:
d u e m i l a q u a t t r o RAPPORT
- Page 561 and 562:
16. LE SPESE PER LA TUTELA DELL’A
- Page 563 and 564:
- al primo stadio, ci si è avvalsi
- Page 565 and 566:
Per quanto riguarda la distribuzion
- Page 567 and 568:
16.2 16.2LE LE SPESE AMBIENTALI DEL
- Page 569 and 570:
LE SPESE PER LA TUTELA DELL’AMBIE
- Page 571 and 572:
Alcuni termini di finanza pubblica
- Page 573 and 574:
destinatari sono i Comuni cui media
- Page 575 and 576:
della regione di interventi per la
- Page 577 and 578:
(ai quali vengono destinati l’8%
- Page 579 and 580:
50 45 40 35 30 25 20 15 10 5 - 1995
- Page 581 and 582:
100% Gestione delle acque reflue (C
- Page 583 and 584:
16.2.4 TAVOLE 16.2.4 TAVOLE STATIST
- Page 585 and 586:
LE SPESE PER LA TUTELA DELL’AMBIE
- Page 587 and 588:
LE SPESE PER LA TUTELA DELL’AMBIE
- Page 589 and 590:
16.2.5 BIBLIOGRAFIA 16.2.5 BIBLIOGR
- Page 591 and 592:
Assi Prioritari Annualità Spesa Pu
- Page 593 and 594:
LA PROGRAMMAZIONE REGIONALE DEI PRI
- Page 595 and 596:
APQ8 sulle risorse idriche APQ8 sul
- Page 597 and 598:
18. 17. I I PROGRAMMI DI DI INFORMA
- Page 599 and 600:
18.2.1 I 18.2.1 LABORATORI I LABORA
- Page 601 and 602:
messa a punto di un sistema di indi
- Page 603 and 604:
I PROGRAMMI DI INFORMAZIONE ED EDUC