Linfomi ed esposizioni ambientali - Associazione Italiana Registri ...
Linfomi ed esposizioni ambientali - Associazione Italiana Registri ...
Linfomi ed esposizioni ambientali - Associazione Italiana Registri ...

Create successful ePaper yourself
Turn your PDF publications into a flip-book with our unique Google optimized e-Paper software.
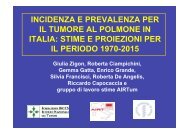
<strong>Linfomi</strong> <strong>ed</strong> <strong>esposizioni</strong><br />
<strong>ambientali</strong><br />
L. Miligi<br />
U.O. di Epidemiologia ambientale <strong>ed</strong> Occupazionale<br />
ISPO Istituto per lo studio e la prevenzione oncologica<br />
Corso per operatori dei registri tumori<br />
3 Aprile 2009<br />
Dip. Sanità Pubblica –Az. USL Reggio Emilia
Morton, 2006
Increasing levels of NHL: USA<br />
• Consistent<br />
increase in rates<br />
in both sexes<br />
• Rate of increase<br />
between 3-4%<br />
per year from<br />
1973-1996<br />
• From 1992-2001,<br />
EAPC has not<br />
chang<strong>ed</strong><br />
significantly, but<br />
rates remain<br />
elevat<strong>ed</strong>.<br />
* nine-registry<br />
data<br />
Sources: Surveillance, Epidemiology, and End Results (SEER) Program<br />
(www.seer.cancer.gov) SEER*Stat Database, and SEER Cancer Statistics Review, 1973-2001,<br />
National Cancer Institute. Bethesda, MD.
Le cause di queste neoplasie sono ancora<br />
largamente sconosciute e le cause note ne<br />
spiegano solo una piccola quota.<br />
Un punto critico degli studi è dato dalla complessità delle<br />
classificazioni e dal cambiamento dei criteri classificatori<br />
Recentemente nell’ambito del network internazionale InterLymph è<br />
stato proposto uno schema classificatorio che si basa sulla WHO e<br />
che prev<strong>ed</strong>e la possibilità di trasferire in questo schema casistiche<br />
classificate in modo diverso per poter accogliere studi fatti<br />
prec<strong>ed</strong>entemente all’introduzione di REAL/WHO
Rischi aumentati per:<br />
Immunosoppressione congenita (Ataxia/teleangectasia) e<br />
acquisita (HIV, Transplant recipients)<br />
EBV (Burkitt)<br />
Soggetti affetti da malattie autoimmunitarie (Artrite<br />
reumatoide, Lupus, Sjogren ..)<br />
Altri fattori che sono risultati associati a NHL<br />
Numerose infezioni croniche malattie infiammatorie (epatite , H. Pylori,<br />
herpes zoster, mononucleosi, malaria, tubercolosi, diabete)<br />
Familiarità<br />
Abitudini di vita<br />
Esposizioni occupazionali <strong>ed</strong> <strong>ambientali</strong>
Storia di pregresse malattie e rischio di<br />
tumori maligni emolinfopoietici<br />
Rischi aumentati di NHL<br />
per<br />
Lupus eritematosus<br />
Rischi aumentati di NHL<br />
mononucleosi<br />
Epatite<br />
Tubercolosi<br />
Vineis et al. 2000
Prec<strong>ed</strong>enti patologie e rischio di NHL<br />
Malattie autoimmuni , epatite C, diabete,<br />
Malattie autoimmuni ( risultati analisi pool<strong>ed</strong> Interlymph<br />
Consortium)<br />
12 studi caso controllo 29423 casi<br />
Sindrome di Sjogren aumento di rischio (diffuse large B cell e<br />
margianl zone<br />
Anemia emolitica e diffuse large B-cell<br />
Lupus aumento di rischio diffuse large B cell<br />
Morbo celiaco e psoriasi Tcell NHL<br />
artrite reuamtoide risultati eterogenei<br />
Altre patologie quali sclerosi multipla diabete typo 1 , sarcoidosi ,<br />
Inflammatory Bowel disease non associate malattie nello studio pool<strong>ed</strong>
FAMILIARITA’
Wang et al,2007<br />
Pool<strong>ed</strong> risk estimates<br />
NHL<br />
network<br />
internazionale<br />
InterLymph
smooking
2006
2008
NHL ED<br />
OCCUPAZIONI
Aumenti di rischio per occupazioni come :<br />
‣agricoltori,<br />
‣ professioni m<strong>ed</strong>iche<br />
‣ lavoratori elettrici<br />
‣lavoratori della pelle<br />
‣Insegnanti<br />
‣Verniciatori<br />
‣lavoratori dei trasporti<br />
‣Parucchieri<br />
‣lavoratori tessili<br />
‣Lavanderie<br />
un recente studio t<strong>ed</strong>esco osserva aumenti di rischio di<br />
diffuse large B cell lymphoma nei lavoartori dei metalli <strong>ed</strong><br />
una aumento di follicular lymphoma per m<strong>ed</strong>ici veterianri dentisti , commess<br />
machineri fitters <strong>ed</strong> elettrical fitters ( mester 2006)
STUDIO CASO-<br />
CONTROLLO<br />
MULTICENTRICO<br />
ITALIANO SULLE<br />
NEOPLASIE MALIGNE<br />
DEL SISTEMA<br />
EMOLINFOPOIETICO
LO STUDIO CASO-CONTROLLO CONTROLLO MULTICENTRICO<br />
ITALIANO SULLE NEOPLASIE MALIGNE DEL SISTEMA<br />
EMOLINFOPOIETICO E’ STATO DISEGNATO CON<br />
L’OBIETTIVO DI STUDIARE L’ASSOCIAZIONE L<br />
TRA:<br />
• L’ESPOSIZIONE A PESTICIDI E LINFOMA<br />
NON-HODGKIN, L’ESPOSIZIONE A SOLVENTI E<br />
LEUCEMIE<br />
Lo studio è stato condotto in 11 aree :<br />
- due aree industrializzate (Città di Torino, Provincia di Varese<br />
- sei aree prevalentemente agricole (Provincie(<br />
di Imperia,<br />
Novara, Vercelli, , Forlì, Siena, Ragusa)<br />
- tre aree miste (Provincie(<br />
di Verona, Firenze e Latina)
CASI<br />
• Sono stati identificati tutti i casi incidenti, tra il 1990 e 1993, 1<br />
di<br />
Linfoma non-Hodgkin<br />
(NHL) (ICD XI 200, 202); Leucemia (ICD<br />
IX 204-208); 208); Mieloma multiplo (ICD IX 203) , Linfoma di<br />
Hodgkin ( ICD IX 201) di età compresa 20-74 anni e residenti nel<br />
aree in studio<br />
• N casi intervistati = 2737<br />
CONTROLLI<br />
• Un campione casuale di popolazione, di età 20-74 anni e resident<br />
in ogni area in studio, stratificato per sesso e per età sulla base de<br />
numero dei casi nel gruppo più numeroso (NHL+CLL(<br />
NHL+CLL)<br />
• N = 1779 controlli
RACCOLTA DELLE INFORMAZIONI<br />
Casi e controlli sono stati intervistati da personale<br />
specializzato. L’intervista<br />
L<br />
è stato realizzata tramite un<br />
questionario strutturato volto a raccogliere le seguenti<br />
informazioni :<br />
• istruzione<br />
• abitudini di vita<br />
• dettagliata raccolta dell’ anamnesi professionale (questionari specifici pe<br />
occupazione/mansione-coltura/infestanti<br />
coltura/infestanti)<br />
• uso di coloranti per capelli<br />
• storia residenziale<br />
• anamnesi patologica<br />
• assunzione di farmaci<br />
• storia familiare
Occupazioni associate a rischio OR e IC 95% -UOMINI-<br />
NHL<br />
HD<br />
Leuk<br />
MM<br />
(949) (193) (383) (133)<br />
Menagers e dirig<br />
Cuochi , camerieri<br />
Add servizi pulizia<br />
Barbieri, parr.<br />
Tessili<br />
Sarti<br />
Metallurgici<br />
Servizi di polizia<br />
Lavoratori elettrici<br />
Saldatori<br />
47 1.8 1.1-2.9<br />
7 2.4 1.0-5.5<br />
21 2.2 1.2-4.0<br />
8 1.8 0.8-4.3<br />
28 1.5 0.8-2.7<br />
11 1.4 0.7-3.0<br />
22 1.9 0.9-3.9<br />
8 1.4 0.5-3.7<br />
5 2.2 0.7-6.<br />
12 2.4 1.3-4.6<br />
7 3.5 1.3-9.6<br />
8 2.3 0.8-6.6<br />
5 3.6 1.3-10.5<br />
10.5<br />
28 2.8 1.4-5.8<br />
3 3.1 0.8-12.0<br />
8 2.3 0.8-6.5<br />
2 1.3 0.3-6.2<br />
20 1.9 0.9-3.9<br />
7 2.5 0.9-7.0<br />
4 3.4 1.0-11.7<br />
11.7<br />
19 1.2 0.6-2.3<br />
2 0.6 0.6-2.9<br />
6 0.9 0.3-2.3<br />
7 3.3 1.3-8.5<br />
Seniori, Epidemiology 2001
Occupazioni associate a rischio OR e IC 95% -DONNE<br />
NHL<br />
HD<br />
DONNE-<br />
Leuk<br />
MM<br />
. (134)<br />
(611) (165) (260) (134)<br />
Insegnanti<br />
38 1.7 1.0-2.7<br />
11 1.8 0.8-3.7<br />
16 1.5 0.8-2.7<br />
4 0.8 0.3-2.3<br />
Professioni sanitarie<br />
18<br />
1.4 0.7-2.7<br />
- 8 1.7 0.7-4.2<br />
Cuochi , camerieri<br />
30 1.4 0.8-2.4<br />
6 1.8 0.9-3.7<br />
14 1.8 0.9-3.7<br />
3 0.5 0.2-1.8<br />
Barbieri, parr.<br />
9 1.9 0.7-5.8<br />
5 2.1 0.7-6.5<br />
5 2.2 0.7-7.1<br />
7.1 3 11.1 1.8-67.0<br />
Addette Lavanderie<br />
10<br />
0.7 0.3-1.5<br />
7 3.5 1.5-8.2<br />
5 1.1 0.4-3.2<br />
3 1.0 0.3-3. 3. 8<br />
Tessili<br />
83 1.1 0.8-1.5<br />
11 1.1 0.6-2.2<br />
14 1.2 0.6-2.3<br />
11 1.6 0.7-3.4<br />
Addette lavor.<br />
Plastica<br />
7 1.5 0.5-4.8<br />
- - -<br />
Miligi, Am J Ind M<strong>ed</strong>, , 1999
2007
Esposizione occupazionale dei genitori e NHL ( Colt , e Blair,<br />
1993)<br />
Studi meno numerosi rispetto alle leucemie<br />
Aumenti di rischio per leucemie e linfomi per esposizione paterna<br />
a benzene (McKinney 1991) , xilene,tetracloruro di carbonio,TCE<br />
e per occupazione one paterna come verniciatore meccanico di<br />
veicoli a motore, benzinaio,autista , industria nucleare<br />
Esposizione occupazionale della madre <strong>ed</strong> aumenti di rischio per<br />
Parucchiera, catering addette alle pulizie<br />
Uso domestico di insetticidi durante la gravidanza <strong>ed</strong> uso paterno<br />
associato con aumenti di rischio NHL (Rudant, 2007)
ESPOSIZIONE<br />
A<br />
FITOFARMACI<br />
E NHL
Studi epidemiologici sugli agricoltori: risultati dalle coorti metaanalisi<br />
Blair 1992, Acquavella 1998)<br />
Cause di morte in difetto<br />
Cause di morte in eccesso<br />
Tutte le cause<br />
- Cardiovascolari<br />
Tutti i tumori<br />
Polmone<br />
Vescica<br />
Fegato<br />
Colon<br />
Esofago<br />
Retto<br />
Rene<br />
Infortuni<br />
Non Hodgkin Lymphoma<br />
Leucemie<br />
Mieloma Multiplo<br />
Sarcoma dei tessuti molli<br />
Tumori della pelle<br />
Labbro<br />
Prostata<br />
Stomaco<br />
Cervello
STUDI CASO CONTROLLO CHE HANNO ESAMINATO L’ASSOCIAZIONE L<br />
TRA LINFOM<br />
ED ESPOSIZIONE A ERBICIDI FENOSSIACETICI<br />
AUTORE, ANNO, PAESE<br />
PATOLOGIA<br />
R.R.<br />
Hardell, 1981, Svezia<br />
Hoar, 1986, USA<br />
Pearce, 1987, Nuova<br />
Zelanda<br />
Woods, 1987, USA<br />
Persson, 1989, Svezia<br />
Hoar Zahm, 1990, USA<br />
Cantor, 1992, USA<br />
Hardell, 1999, Svezia<br />
Mc Duffie, 2001, Canada<br />
Hardell, 1981, Svezia<br />
Hoar, 1986, USA<br />
Non Hodgkin Lymphoma<br />
Non Hodgkin Lymphoma<br />
Non Hodgkin Lymphoma<br />
Non Hodgkin Lymphoma<br />
Non Hodgkin Lymphoma<br />
Non Hodgkin Lymphoma<br />
Non Hodgkin Lymphoma<br />
Non Hodgkin Lymphoma<br />
Non Hodgkin Lymphoma<br />
Hodgkin Disease<br />
Hodgkin Disease<br />
4.7 *<br />
2.2 *<br />
1.0<br />
1.2<br />
1.6<br />
1.5<br />
1.2<br />
1.5<br />
1.4 *<br />
5.0 *<br />
1.0
STUDIO CANADESE 517 casi e 1400 controlli<br />
Chemical Classes / individual chemical<br />
N° expos<strong>ed</strong><br />
cases<br />
OR 95% CI<br />
HERBICIDES<br />
Phenoxyherbicides<br />
2,4-D<br />
mecoprop<br />
MCPA<br />
Phosphonic acid<br />
Glyphosate (Round-up)<br />
up)<br />
Dicamba<br />
INSECTICIDES<br />
Carbamates<br />
Carbaryl<br />
methomyl<br />
Classi chimiche associate a incrementi di Rischio di NHL<br />
131<br />
111<br />
53<br />
17<br />
63<br />
51<br />
73<br />
37<br />
25<br />
6<br />
1.38 1.06-1.81<br />
1.81<br />
1.32 1.01-1.73<br />
1.73<br />
2.33 1.58-3.44<br />
1.10 0.60-2.00<br />
1.40 0.94-1.89<br />
1.20 0.83-1.74<br />
1.88 1.32-2.68<br />
2.68<br />
1.92 1.22-3.94<br />
2.11 1.21-3.64<br />
1.65 0.65-5.03<br />
5.03<br />
Mc Duffie et al., 2001
Chemical Classes / individual<br />
chemical<br />
INSECTICIDES<br />
Organochlorine<br />
lindane<br />
aldrin<br />
DDT<br />
Organophosphuros<br />
malathion<br />
diazinon<br />
FUNGICIDES<br />
N° expos<strong>ed</strong> cases<br />
50<br />
15<br />
10<br />
32<br />
90<br />
72<br />
18<br />
OR 95% CI<br />
1.27 0.74-1.69<br />
2.06 1.01-4.22<br />
4.19 1.48-11.96<br />
11.96<br />
1.73 1.08-2.76<br />
1.73 1.27-2.36<br />
2.36<br />
1.83 1.31-2.55<br />
1.68 0.88-3.24<br />
amides<br />
captan<br />
Sulphur compounds<br />
30<br />
20<br />
17<br />
1.70 1.04-2.78<br />
2.51 1.32-4.76<br />
2.80 1.41-5.57<br />
(Mc Duffie et al., 2001)
2008
2008
1996
STUDIO CASO-<br />
CONTROLLO<br />
MULTICENTRICO<br />
ITALIANO SULLE<br />
NEOPLASIE MALIGNE<br />
DEL SISTEMA<br />
EMOLINFOPOIETICO
• Definizione dell’ esposizione .<br />
• per quanto riguarda l’attività in agricoltura , esperti<br />
agronomi (uno per ogni centro ) hanno rivisto le<br />
informazioni raccolte nei questionari e tradotte in<br />
una storia di <strong>esposizioni</strong> a pesticidi per<br />
‣ tipo di trattamento ( es. erbicidi)<br />
‣ famiglie chimiche (es. erbicidi fenossiacetici)<br />
‣ principi attivi ( es 2,4-D; MCPA)
FUNGICIDI<br />
ORs e 95% CI per classi chimiche e principio attivo per NHL, leucemie<br />
e Mieloma multiplo – probabilità di uso >bassa - uomini e donne<br />
Classe chimica<br />
<strong>Linfomi</strong> Leucemie Mieloma multiplo<br />
Principio attivo Casi esp. OR IC 95% Casi esp. OR IC 95% Casi esp. OR IC 95%<br />
Ditiocarbammati 76 0,9 0,6-1,2 42 1,3 0,9-2,0 21 1,5 0,8-2,6<br />
- Zineb 34 0,7 0,4-1,1 27 1,2 0,7-2,0 17 1,5 0,8-2,9<br />
- Ziram 18 1,8 0,8-4,2 15 1,9 0,9-3,9 3 1,1 0,3-4,0<br />
- Mancozeb 11 0,8 0,4-1,9 11 1,1 0,5-2,3 5 1,4 0,5-4,2<br />
- Thiram 2 5 1,5 0,5-4,5 2<br />
Tioftalimide 8 1,0 0,4-2,9 5 1,5 0,5-4,7 4 2,1 0,6-7,8<br />
Nitro derivati 29 0,9 0,5-1,6 7 0,8 0,3-2,0 4 1,1 0,3-3,5<br />
- Dinocap 21 1,1 0,5-2,1 7 0,9 0,4-2,3 4 1,3 0,4-4,2<br />
Benzimidazoli 16 1,2 0,5-2,4 9 1,8 0,8-4,4 3 1,4 0,3-5,8<br />
- Benomyl 12 1,4 0,5-3,4 8 2,5 0,9-6,7 2<br />
Fenilammidi 25 2,0 1,0-4,0 6 1,2 0,4-3,4 2<br />
- Vinclozolin 12 1,7 0,6-4,5 3 1,0 0,3-4,2 2<br />
OR corretti per sesso, età e centro<br />
Da Miligi 2003 modificata
INSETTICIDI<br />
ORs e 95% CI per classi chimiche e principio attivo per NHL, leucemie<br />
e Mieloma multiplo – probabilità di uso >bassa - uomini e donne<br />
Classe chimica<br />
<strong>Linfomi</strong> Leucemie Mieloma multiplo<br />
Principio attivo Casi esp. OR* IC 95% Casi esp. OR** IC 95% Casi esp. OR** IC 95%<br />
Carbammati 36 0,8 0,5-1,4 14 0,8 0,4-1,5 9 1,2 0,5-2,<br />
- Carbaryl 20 1,3 0,6-2,7 7 1,2 0,5-3,1 4 1,1 0,3-3,<br />
Cicloesani 22 1,4 0,7-2,6 12 1,8 0,8-4,0 3 1,0 0,2-3,<br />
- Lindano 11 2,0 0,7-5,9 5 3,2 0,8-12,6 1<br />
Difeniletano 26 0,5 0,3-0,9 18 0,9 0,5-1,6 13 1,1 0,5-2,<br />
- DDT 26 0,5 0,3-0,9 18 0,9 0,5-1,6 13 1,1 0,5-2,<br />
Fosfati 5 1,1 0,3-4,0 4 1,9 0,5-7,4 3 4,3 0,8-22<br />
Tiolofosfati 54 1,1 0,7-1,7 19 1,0 0,7-2,5 12 1,3 0,6-2,<br />
Tionofosfati 61 0,9 0,6-1,4 25 1,0 0,5-1,8 14 1,2 0,6-2,<br />
Fosfammidi 17 1,3 0,6-2,8 10 1,9 0,8-4,5 4 2,5 0,7-8,<br />
Derivati idrocarburi<br />
- Bromuro 12 1,8 0,6-4,9 4 1,6 0,4-6,0 3 4,8 1,0-23<br />
Oli insetticidi 12 1,9 0,7-5,2 10 3,9 1,4-11,8 3 2,3 0,4-9,<br />
OR corretti per sesso, età e centro<br />
Da Miligi 2003 modificata
Lavorare senza<br />
protezione<br />
Lavoratore agricolo –<br />
mansioni di rientro
Risk of NHL <strong>ed</strong> esposizione a erbicidi fenossiacetici<br />
Odds ratios (OR) aggiustati per sesso, età e centro.<br />
Casi<br />
Controlli<br />
OR 95% CI<br />
Phenoxy herbicides<br />
Tutti 32 28 1.1 0.6-1.8<br />
Probabilità di uso >bassa<br />
E mancanza di DPI 13 6 2.4 0.9-7.6<br />
2,4-D<br />
Tutti 17 18 0.9 0.5-1.8<br />
Probabilità<br />
di uso >bassa<br />
E mancanza di DPI 9 3 4.4 1.1-29.1<br />
MCPA<br />
Tutti 18 19 0.9 0.4-1.8<br />
Probabilità di uso >bassa<br />
E mancanza di DPI 7 3 3.4 0.8-23.2<br />
Miligi et al. 2006
Numero di casi di NHL e controlli che applicano o mescolano 2,4 D per<br />
momento in cui cambiano I vestiti usati durante l’uso della sostanza<br />
Quando i soggetti<br />
cambiano gli abiti<br />
da lavoro<br />
casi<br />
Controlli<br />
OR 95% CI<br />
Non hanno mai vissuto<br />
o lavorato in un’<br />
azienda agricola<br />
54<br />
184<br />
1.0<br />
Imm<strong>ed</strong>iatamente dopo<br />
l’uso Della sostanza<br />
6<br />
19<br />
1.1 0.4-3.1<br />
Alla fine del giorno di<br />
lavoro<br />
31<br />
73<br />
1.5 0.8-2.6<br />
I giorni seguenti e più<br />
tardi<br />
6<br />
4<br />
4.7 1.1-21.5<br />
Zham et al,1990
META ANALISI DI STUDI CASO CONTROLLO<br />
ESPOSIZIONI OCCUPAZIONALE A PESTICIDI E RISCHIO DI TUMORI<br />
EMOLINFOPOIETICI , Merhi M et al , 2007<br />
Tumori<br />
emolinfopoietici<br />
OR IC 95%<br />
NHL<br />
OR IC 95%<br />
Leucemie<br />
OR IC 95%<br />
Mieloma<br />
multiplo<br />
OR IC 95%<br />
OR<br />
complessivo<br />
1.33 ( 1.2-1.5)<br />
1.35 ( 1.17-1.55)<br />
1.35 (0.9-2.0)<br />
1.16 (1.0-1.4)
The association of non-Hodgkin lymphoma (NHL) among farmers associat<strong>ed</strong> with chemical<br />
classes of herbicides according to t(14;18) status<br />
Herbicide use<br />
Never us<strong>ed</strong><br />
pesticides<br />
Phenoxyacetic<br />
acids<br />
Control<br />
subjects<br />
t(14;18)-positive NHL vs<br />
control subjects<br />
Case<br />
subjects<br />
OR (95%<br />
CI) *<br />
t(14;18)-negative NHL<br />
vs control subjects<br />
Case<br />
subjects<br />
OR (95%<br />
CI) *<br />
P for<br />
difference †<br />
229 5 1.0 (referent) 23 1.0 (referent) NA<br />
No ‡ 31 4 5.0 (1.2-<br />
20.8)<br />
4 1.5 (0.5-4.8) .2<br />
Yes 180 14 2.9 (1.0-8.4) 14 0.8 (0.4-1.6) .04<br />
Triazines<br />
No ‡ 88 6 2.8 (0.8-9.5) 7 0.9 (0.4-2.1) .1<br />
Yes 114 11 3.4 (1.1-<br />
10.4)<br />
Amides<br />
11 1.0 (0.4-2.2) .07<br />
No ‡ 103 7 2.8 (0.8-9.1) 8 0.8 (0.4-2.0) .1<br />
Yes 99 10 3.5 (1.1-<br />
11.0)<br />
Benzoic acids<br />
10 1.0 (0.4-2.3) .08<br />
No ‡ 143 11 3.0 (1.0-9.0) 12 0.9 (0.4-1.9) .07<br />
Yes 58 6 3.5 (1.0-<br />
13.0)<br />
Carbamates<br />
6 1.0 (0.4-2.9) .1<br />
No ‡ 151 12 2.9 (1.0-8.7) 11 0.8 (0.4-1.7) .05<br />
Yes 50 5 3.9 (1.0-<br />
14.5)<br />
Dinitroanilines<br />
No ‡ 141 13 3.7 (1.3-<br />
10.8)<br />
7 1.4 (0.5-3.8) .2<br />
11 0.9 (0.4-1.9) .03<br />
Yes 62 4 1.8 (0.4-7.9) 7 1.0 (0.4-2.6) .5<br />
Agricultural pesticid<br />
use and risk of<br />
t(14;18)-defin<strong>ed</strong><br />
subtypes of non-<br />
Hodgkin lymphoma<br />
Brian C.-H. Chiu, 200<br />
NA indicates not applicable.<br />
* Odds ratios (ORs) and confidence intervals (CIs), adjust<strong>ed</strong> for age (4 levels), sex, type of respondent (direct or proxy<br />
interview), and family history of cancer (yes or no).
Chiu, 2006<br />
The association of non-Hodgkin lymphoma (NHL) with agricultural pesticides and farming<br />
activities according to t(14;18) status<br />
Farming status<br />
Control<br />
subjects *<br />
t(14;18)-positive NHL<br />
vs control subjects<br />
Case OR (95%<br />
subjects † CI) ‡<br />
Nonfarmers 419 19 2.0 (0.7-<br />
5.5)<br />
Farmers<br />
Never us<strong>ed</strong><br />
pesticides<br />
229 5 1.0<br />
(referent)<br />
Us<strong>ed</strong> pesticides 730 37 2.1 (0.8-<br />
5.4)<br />
Animal<br />
insecticides<br />
11 y<br />
more<br />
Less than<br />
11 y or<br />
Crop<br />
insecticides<br />
12 y<br />
more<br />
17 y<br />
more<br />
417 27 2.6 (1.0-<br />
6.9)<br />
104 5 2.0 (0.5-<br />
7.0)<br />
107 9 3.2 (1.0-<br />
10.1)<br />
Missing 206 13 2.8 (1.0-<br />
7.9)<br />
Less than<br />
12 y or<br />
301 22 3.0 (1.1-<br />
8.2)<br />
82 4 2.1 (0.5-<br />
8.1)<br />
87 9 3.8 (1.2-<br />
12.2)<br />
Missing 132 9 3.0 (1.0-<br />
9.3)<br />
Herbicides 352 25 2.9 (1.1-<br />
7.9)<br />
Less than<br />
17 y or<br />
104 7 2.9 (0.9-<br />
9.4)<br />
109 9 3.2 (1.0-<br />
10.1)<br />
Missing 139 9 3.0 (1.0-<br />
9.1)<br />
t(14;18)-negative NHL<br />
vs control subjects<br />
Case OR (95%<br />
subjects § CI) ‡<br />
P for<br />
difference<br />
31 0.7 (0.4-1.3) .09<br />
23 1.0<br />
(referent)<br />
NA<br />
48 0.7 (0.4-1.2) .04<br />
27 0.7 (0.4-1.3) .02<br />
8 0.9 (0.4-2.0) .3<br />
9 0.9 (0.4-2.1) .08<br />
10 0.5 (0.2-1.1) .01<br />
21 0.7 (0.4-1.4) .02<br />
7 0.9 (0.4-2.3) .3<br />
6 0.8 (0.3-2.0) .03<br />
8 0.6 (0.2-1.4) .02<br />
22 0.7 (0.3-1.2) .01<br />
8 0.8 (0.3-2.0) .09<br />
8 0.8 (0.3-1.9) .06<br />
6 0.4 (0.1-1.1) .007<br />
Fungicides 59 2 NR 3 NR NA<br />
Rodentcides 523 28 2.2 (0.8-<br />
5.8)<br />
Fumigants 112 14 5.0 (1.7-<br />
14.5)<br />
39 0.8 (0.5-1.4) .07<br />
9 0.8 (0.3-1.8) .006
Table 3.<br />
The association of non-Hodgkin lymphoma (NHL) among farmers with chemical classes of<br />
insecticides according to t(14;18) status<br />
Insecticide use<br />
Never us<strong>ed</strong><br />
pesticides<br />
Organochlorines<br />
Control<br />
subjects<br />
t(14;18)-positive NHL<br />
vs control subjects<br />
Case<br />
subjects<br />
OR (95%<br />
CI) *<br />
229 5 1.0<br />
(referent)<br />
t(14;18)-negative NHL<br />
vs control subjects<br />
Case<br />
subjects<br />
OR (95%<br />
CI) *<br />
23 1.0<br />
(referent)<br />
P for<br />
difference †<br />
No ‡ 190 6 1.1 (0.3-3.9) 11 0.6 (0.3-1.3) .4<br />
Yes 164 17 3.8 (1.3-<br />
10.9)<br />
Carbamates<br />
—<br />
18 1.2 (0.6-2.4) .06<br />
No ‡ 251 12 1.8 (0.6-5.4) 18 0.8 (0.4-1.5) .2<br />
Yes 73 11 5.1 (1.6-<br />
16.0)<br />
Organophosphates<br />
8 1.1 (0.5-2.8) .04<br />
No ‡ 209 7 1.2 (0.4-4.2) 12 0.6 (0.3-1.3) .3<br />
Yes 128 17 4.6 (1.6-<br />
13.2)<br />
Pyrethroids<br />
15 1.2 (0.6-2.5) .04<br />
No ‡ 269 14 1.9 (0.7-5.6) 23 0.9 (0.5-1.7) .2<br />
Yes 55 8 4.9 (1.5-<br />
16.6)<br />
3 NR § NA<br />
Agricultur<br />
pesticide u<br />
and risk of<br />
t(14;18)-<br />
defin<strong>ed</strong><br />
subtypes o<br />
non-Hodg<br />
lymphoma<br />
Brian C.-H.<br />
Chiu, 2006<br />
NR indicates not report<strong>ed</strong>; NA, not applicable.<br />
* Odds ratios (ORs) and confidence intervals (CIs), adjust<strong>ed</strong> for age (4 levels), sex, type of respondent (direct or proxy<br />
interview), and family history of cancer (yes or no).
2006
PESTICIDI E TUMORI INFANTILI<br />
I bambini possono essere esposti a pesticidi :<br />
• Vivono in fattoria o vicino ad una fattoria.<br />
Esposizione si può verificare durante i trattamenti, ma<br />
anche prima e dopo.<br />
L’esposizione può essere portata in ambiente<br />
domestico dagli stessi parenti attraverso i vestiti e i<br />
dispositivi utilizzati in agricoltura<br />
• Pesticidi usati in ambiente domestico, orti , giardini<br />
(uso di prodotti per piante ornamentali contaminazione del<br />
pavimento, dove , specie da piccolo, il bambino può soggiornare<br />
spesso; giocattoli)<br />
• Uso di presidi m<strong>ed</strong>ico-chirurgici<br />
chirurgici (es. prodotti per la p<strong>ed</strong>iculosi)<br />
• Acqua <strong>ed</strong> alimenti
Sono stati osservati aumenti di rischio di tumori infantili :<br />
• Per uso di pesticidi da parte dei genitori in casa o nel giardino,<br />
occupazione della madre in agricoltura o uso di pesticidi durante la<br />
gravidanza<br />
• Occupazione del padre<br />
• Esposizione diretta del bambino<br />
In particolar modo per leucemie, tumori del SNC, ma anche per il<br />
neuroblastoma, LNH e tumore di Wilms ( Zahm 1998)<br />
Molti dei tumori infantili associati a pesticidi, sono stati<br />
ripetutamente associati anche nell’ adulto<br />
Nonostante i numerosi studi condotti (per lo più di tipo caso–<br />
controllo) siano limitati dalla mancanza di informazioni specifiche<br />
sui pesticidi, il numero limitato di soggetti esposti e problemi di<br />
recall bias l’entità dei rischi osservati è maggiore rispetto all’ adulto<br />
facendo presupporre una maggiore suscettibilità.
2000
2007
Agricultural health study<br />
OR 1.98 (1.05-1.79)<br />
1.79) tra i bambini i cui padri non avevano<br />
mai usato idonei DPI (<br />
guanti ). Aumento di rischio soprattutto per esposizione a Aldrin, Dichlorvos <strong>ed</strong><br />
ethyl dipropylthiocarbamate<br />
Flower KB , Environ Helth Perspect 2004
NHL E SOLVENTI
BENZENE E<br />
LEUCEMIA<br />
NHL?<br />
Ma per
STUDIO CASO-<br />
CONTROLLO<br />
MULTICENTRICO<br />
ITALIANO SULLE<br />
NEOPLASIE MALIGNE<br />
DEL SISTEMA<br />
EMOLINFOPOIETICO
Alcuni risulatati dallo studio multicentrico italiano<br />
DEFINIZIONE DELL’ESPOSIZIONE<br />
ESPOSIZIONE - INDUSTRIA<br />
Uso di questionari specifici occupazione / mansione<br />
Igienisti industriali/ m<strong>ed</strong>ici del lavoro (uno per ogni area)<br />
che hanno rivisto i questionari<br />
Assegnando un<br />
8 centri<br />
Livello di probabilità<br />
3 livelli (bassa, m<strong>ed</strong>ia, alto)<br />
Livello di intensità<br />
4 livelli ( molto bassa, bassa, m<strong>ed</strong>ia, alta)
Solventi<br />
ORs e 95% CI per NHL e livelli di esposizione a solventi ( P>1<br />
Solvente<br />
Intensità di<br />
esposizione<br />
n°casi<br />
Exp.<br />
OR*<br />
IC 95%<br />
Benzene<br />
Molto bassa/Bassa<br />
49<br />
0.6<br />
0.4-0.9<br />
M<strong>ed</strong>ia/Alta<br />
58<br />
1.6<br />
1.0-2.4<br />
Stirene<br />
Molto bassa/Bassa<br />
9<br />
0.7<br />
0.3-1.6<br />
M<strong>ed</strong>ia/Alta<br />
14<br />
1.3<br />
0.6-2.9<br />
Xilene<br />
Molto bassa/Bassa<br />
64<br />
0.7<br />
0.5-1.0<br />
M<strong>ed</strong>ia/Alta<br />
49<br />
1.7<br />
1.0-2.6<br />
Toluene<br />
Molto bassa/Bassa<br />
63<br />
0.7<br />
0.5-1.0<br />
M<strong>ed</strong>ia/Alta<br />
54<br />
1.8<br />
1.1-2.8<br />
Diclorometano<br />
Molto bassa/Bassa<br />
23<br />
0.9<br />
0.7-4.3<br />
M<strong>ed</strong>ia/Alta<br />
13<br />
1.7<br />
0.7-2.0<br />
* ORs aggiustati per età, sesso, istruzione,e area geografica<br />
Miligi et al, 2006
ORs e 95% CI per NHL <strong>ed</strong> esposizione a solventi livello di esposizione<br />
M<strong>ed</strong>io/alto e per durata<br />
Solvente<br />
Intensità di<br />
esposizione<br />
n°casi<br />
Exp.<br />
OR*<br />
IC 95%<br />
Benzene<br />
15 anni<br />
14<br />
2.9<br />
0.9-9.0<br />
Xilene<br />
15 anni<br />
17<br />
2.1<br />
0.9-5.0<br />
Toluene<br />
15 anni<br />
19<br />
2.3<br />
1.0-5.6<br />
ORs aggiustati per età, sesso, istruzione,e area geografica<br />
Miligi et al, 2006
E’ STATO OSSERVATO UN ALTO GRADO DI CORRELAZIONE<br />
TRA BENZENE , TOLUENE E XILENE<br />
SOGGETTI ESPOSTI A LIVELLI MEDIO ALTI DEI 3 SOLVENTI<br />
AROMATICI :<br />
OR per NHL 2,1 95% CI 1.1 -4.3 ( 26 casi esposti)
SOLVENTI<br />
ORs e 95% CI per sottotipo di NHL<br />
SOTTOTIPO DIFFUSO<br />
INDIVIDUAL<br />
CHEMICAL<br />
Benzene<br />
Styrene<br />
Xylene<br />
Toluene<br />
Tetrachloroethylene<br />
Trichloroethylene<br />
No. of<br />
cases<br />
20<br />
3<br />
15<br />
16<br />
5<br />
13<br />
OR<br />
2.4<br />
1.1<br />
2.3<br />
2.4<br />
1.9<br />
1.9<br />
95% CI<br />
1.3-4.5<br />
0.3-4.1<br />
1.2-4.4<br />
1.3-4.6<br />
0.7-5.7<br />
0.9-3.7<br />
Adjust<strong>ed</strong> by gender, age, <strong>ed</strong>ucation and area, ORs shown for at least five expos<strong>ed</strong> cases<br />
Reference group: Subjects who never us<strong>ed</strong> any chemical (OR=1)<br />
Miligi et al, 2006
OR e 95% IC per livelli di intensità di esposizione a solventi per Leucemie,<br />
sottotipi di leucemia e Mieloma Multiple<br />
Leukaemia Acute Myeloid Leukaemia Chronic Lymphatic Leukaemia Multiple Myeloma<br />
ICD: IX (ICD IX: 204-208) (ICD IX: 205.0) (ICD IX: 204.1) (ICD IX: 203)<br />
Exposure<br />
Intensity<br />
level<br />
No. of<br />
cases<br />
No. of<br />
controls<br />
OR* 95% CI No. of<br />
cases<br />
No. of<br />
controls<br />
OR* 95% CI No. of<br />
cases<br />
No. of<br />
controls<br />
OR* 95% CI No.<br />
of<br />
cases<br />
No. of<br />
controls<br />
OR* 95% CI<br />
Individual<br />
chemicals<br />
Benzene Very low/low 16 50 0,5 0,3-0,9 3 50 0,3 0,1-1,0 11 77 0,7 0,3-1,4 8 47 0,6 0,3-1,5<br />
M<strong>ed</strong>ium/high 25 32 1,3 0,7-2,3 6 32 0,9 0,4-2,3 12 35 1,8 0,9-3,9 14 29 1,9 0,9-3,9<br />
Xylene Very low/low 20 64 0,5 0,3-0,9 5 64 0,4 0,2-1,1 15 99 0,9 0,5-1,8 9 59 0,6 0,3-1,4<br />
M<strong>ed</strong>ium/high 10 27 0,7 0,3-1,5 2 27 0,4 0,1-1,8 9 34 1,9 0,8-4,5 6 23 1,2 0,4-3,2<br />
Toluene Very low/low 21 66 0,5 0,3-0,9 5 66 0,4 0,2-1,0 14 99 0,9 0,4-1,6 10 61 0,6 0,3-1,3<br />
M<strong>ed</strong>ium/high 13 28 0,9 0,4-1,7 2 28 0,4 0,1-1,7 10 35 2,1 0,9-4,7 5 24 0,9 0,3-2,7<br />
Dichloromethane Very low/low 7 21 0,7 0,3-1,7 3 21 2 28 0,4 0,1-2,0 4 20 _ _<br />
M<strong>ed</strong>ium/high 2 8 0,5 0,1-2,3 0 8 2 8 1,6 0,3-8,6 0 8 _ _<br />
Tetrachloroethylene Very low/low 6 17 0,6 0,2-1,6 2 17 3 29 3 15 _ _<br />
M<strong>ed</strong>ium/high 7 12 1,0 0,4-2,7 2 12 1 15 2 12 _ _<br />
Trichloroethylene Very low/low 17 34 1,0 0,5-1,8 6 34 1,0 0,4-2,5 8 47 1,2 0,5-2,7 9 28 1,5 0,7-3,5<br />
M<strong>ed</strong>ium/high 11 29 0,7 0,4-1,5 6 29 1,1 0,5-2,9 4 35 0,9 0,3-2,6 5 27 0,9 0,3-2,4<br />
1,1,1 - Very low/low 5 12 0,7 0,2-2,0 1 12 3 23 2 10 _ _<br />
Trichloroethane M<strong>ed</strong>ium/high 5 7 1,4 0,4-4,7 2 7 0 9 1 5 _ _<br />
* Adjust<strong>ed</strong> by gender, age, <strong>ed</strong>ucation and area, ORs shown for at least five expos<strong>ed</strong> cases<br />
° Reference group: Subjects who never us<strong>ed</strong> any chemical (OR=1)
Association of M<strong>ed</strong>ium/High Occupational Solvent Exposure, by Duration of<br />
Exposure, with Chronic Lymphatic Leukaemia and Multiple Myeloma<br />
Chronic Lymphatic leukaemia (ICD IX: 204.1) Multiple Myeloma (ICD IX: 203)<br />
INDIVIDUAL<br />
AGENTS<br />
Benzene 15 years 3 4 4.7 0,8-26.5 5 3 4,1 0.8-20.0<br />
P trend 0.05 P trend 0.10<br />
Xylene<br />
15 years<br />
6<br />
3<br />
25<br />
8<br />
1,8<br />
3.3<br />
0,6-5,2<br />
0.7-15.2<br />
3<br />
3<br />
18<br />
4<br />
0,6<br />
3.1<br />
0.1-2.4<br />
0.6-17.0<br />
P trend 0.09 P trend 0.29<br />
Toluene 15 years<br />
6<br />
4<br />
26<br />
8<br />
1,7<br />
4.4<br />
0,6-5,0<br />
1.1-18.0<br />
2<br />
3<br />
19<br />
4<br />
0,4<br />
3.1<br />
0.1-1.9<br />
0.6-17.2<br />
P trend 0.03 P trend 0.34<br />
Trichloroethylene 15 years 2 11 1,2 0,2-6,2 3 8 1,3 0,3-5,9<br />
P trend 0.87 P trend 0.82<br />
* Adjust<strong>ed</strong> by gender, age, <strong>ed</strong>ucation and area<br />
° Reference group: Subjects who never us<strong>ed</strong> any chemical (OR=1)
Familiarità <strong>ed</strong> esposizione a solventi con probabilità >di bassa e<br />
livello di esposizione >molto bassa<br />
Solvente<br />
Familiarità*<br />
N° CASI<br />
ESPO.<br />
OR**<br />
IC 95%<br />
Solventi<br />
NO<br />
284<br />
1.1<br />
0.9-1.4<br />
SI<br />
18<br />
1.4<br />
0.3-5.2<br />
Benzene<br />
NO<br />
85<br />
1.0<br />
0.7-1.4<br />
SI<br />
10<br />
4.2<br />
0.6-311.8<br />
Xilene<br />
NO<br />
94<br />
1.0<br />
0.7-1.4<br />
SI<br />
6<br />
2.1<br />
0.3-16.2<br />
Toluene<br />
NO<br />
100<br />
1.1<br />
0.8-1.5<br />
SI<br />
7<br />
2.5<br />
0.3-19.0<br />
BTX<br />
NO<br />
61<br />
1.0<br />
0.7-1.5<br />
SI<br />
5<br />
2.5<br />
0.3-22.7<br />
* Almeno un parente prossimo con t.emolinfopoietico, **Rischi aggiustati per età, sesso, istruzione,e area geografica<br />
Vineis, Miligi e Seniori Costantini 2007
Familiarità <strong>ed</strong> esposizione a solventi con probabilità >di bassa e<br />
livello di esposizione >molto bassa<br />
Solvente<br />
Familiarità*<br />
N° CASI<br />
ESPO.<br />
OR**<br />
IC 95%<br />
Solventi<br />
Benzene<br />
Xilene<br />
Toluene<br />
BTX<br />
NO<br />
SI<br />
NO<br />
SI<br />
284<br />
18<br />
61<br />
5<br />
1.1<br />
1.4<br />
1.0<br />
2.5<br />
0.9-1.4<br />
0.3-5.2<br />
NO<br />
Per esposizione 85<br />
a 1.0<br />
benzene 0.7-1.4<br />
10<br />
nella SI categoria a maggiore 4.2 intensità<br />
0.6-311.8<br />
NO<br />
94<br />
1.0<br />
0.7-1.4<br />
SI<br />
( m<strong>ed</strong>io<br />
6<br />
/ alta)<br />
2.1<br />
0.3-16.2<br />
OR 29.8 95% CI 1.4-650.29<br />
NO<br />
100<br />
1.1<br />
0.8-1.5<br />
SI<br />
9 casi esposti 7 2.5<br />
<strong>ed</strong> 1 0.3-19.0<br />
controllo esposto<br />
0.7-1.5<br />
0.3-22.7<br />
* Almeno un parente prossimo con t.emolinfopoietico, **Rischi aggiustati per età, sesso, istruzione,e area geografica<br />
Vineis, Miligi e Seniori Costantini 2007
Rischio per esposizione a solventi e pregresse malattie autoimmunitarie<br />
Vineis, Miligi e Seniori Costantini 2007
2007
2009
NHL e uso di tinture per<br />
capelli
ORs 95% CI per NHL, leucemie, mieloma multiplo e HD e uso di tinture<br />
per capelli<br />
Hair dye use<br />
NHL + CLL<br />
Leukemia<br />
Multiple Myeloma<br />
Hodgkin’s Disease<br />
expos<strong>ed</strong> OR ° 95% CI expos<strong>ed</strong> OR ° 95% CI expos<strong>ed</strong> OR° 95% CI expos<strong>ed</strong> OR° 95%<br />
cases<br />
cases<br />
cases<br />
cases<br />
Ever hair dyes 389 1.0 0.8-1.2 140 1.0 0.7-1.3 73 0.9 0.6-1.3 77 0.8 0.5-1<br />
Permanent hair dyes 295 1.1 0.9-1.4 114 1.2 0.9-1.6 59 1.0 0.7-1.5 46 0.7 0.5-1<br />
Non-permanent hair dyes 136 0.9 0.7-1.2 46 0.9 0.6-1.3 20 0.7 0.4-1.3 42 0.9 0.6-1<br />
Permanent hair dyes by colors<br />
Black 27 0.9 0.5-1.4 20 1.9 1.0-3.4 3 0.7 0.2-2.4 6 0.5 0.2-1.1<br />
Brown 108 1.0 0.7-1.3 39 1.2 0.7-1.8 18 0.8 0.4-1.4 16 0.8 0.5-1.5<br />
R<strong>ed</strong> 26 0.8 0.5-1.4 10 1.0 0.4-2.1 5 0.9 0.3-2.6 7 0.6 0.2-1.2<br />
Blonde 122 0.9 0.7-1.2 43 0.9 0.6-1.3 33 1.1 0.6-1.8 22 0.7 0.4-1.1<br />
Other 33 1.3 0.8-2.2 17 1.5 0.8-2.8 5 0.8 0.2-2.0 - -<br />
ORs adjust<strong>ed</strong> for age and smoking; reference group: never using hair dyes<br />
Miligi et al, 2006
OR° and 95 % CI for NHL,<br />
by Histology type according to the Working formulation<br />
among women who ever us<strong>ed</strong> permanent or non permanent hair dyes<br />
WORKING FORMULATION<br />
PERMANENT HAIR DYES<br />
expos<strong>ed</strong> OR° 95% CI<br />
cases<br />
LOW GRADE<br />
111 1.1 0.8-1.5<br />
A Small lymphocytic<br />
72 1.0 0.7-1.5<br />
B follicular, pr<strong>ed</strong>ominantly small cleav<strong>ed</strong> cell 9 2.3 0.7-8.6<br />
C follicular, mixes small cleav<strong>ed</strong> and large cell 30 1.2 0.8-1.8<br />
INTERMEDIATE GRADE<br />
127 1.2 0.9-1.6<br />
E diffuse small cleav<strong>ed</strong> Women cell who us<strong>ed</strong> black hair dye 32 colors were 1.3 0.8-2.3<br />
F diffuse mix<strong>ed</strong> small and at an large increas<strong>ed</strong> cell risk of developing 35 leukemia 1.1 0.7-1.8<br />
G diffuse large cell (OR = 1.9; 95% CI = 1.0-3.4), 58 1.2 0.8-1.8<br />
in particular<br />
HIGH GRADE<br />
32 0.9 0.5-1.4<br />
chronic lymphocytic leukemia (OR = 3.0; 95% CI = 1.1-7.5).<br />
H large cell<br />
27 0.8 0.5-1.4<br />
J Small noncleav<strong>ed</strong> cell<br />
4 1.4 0.3-6.1<br />
MISCELLANEOUS<br />
Mycosis fungoides<br />
6 1.4 0.4-4.9<br />
ORs adjust<strong>ed</strong> for age and smoking, reference group: never using hair dyes<br />
Miligi et al, 2005
Morton 2007
Radiazioni non ionizzanti<br />
Esposizione a radiazione UV<br />
Risultati contrastanti anche se<br />
due recenti studi caso controllo<br />
Hannp mostrano un’ associazione<br />
inversa<br />
Analisi pool<strong>ed</strong> del 2008 su 10 studi mostra un effetto protettivo all’ aumentare<br />
dell’esposizione solare per motivi ricreativi<br />
Alcuni studi hanno mostrato un<br />
aumento di rischio di NHL in soggetti<br />
con tumori della pelle<br />
e anche viceversa
Diossina e NHL<br />
Ruolo del 2,3,4,7,8-TCDD non solo come contaminante di<br />
alcuni pesticidi (erbicidi fenossiacetici -2,4-D; 2,4,5-T)<br />
Numerosi studi su esposti a TCDD hanno mostrato aumenti<br />
di mortalità <strong>ed</strong> incidenza per NHL<br />
Inceneritori e NHL :<br />
Rischio 2.3 volte più alto in soggetti che erano vissuti nell’<br />
area con la più alta concentarzione di diossina ( Floret,<br />
2003,2007)
Kogevinas et<br />
al,<br />
1997