Studio generale - Provincia di Viterbo
Studio generale - Provincia di Viterbo
Studio generale - Provincia di Viterbo

Create successful ePaper yourself
Turn your PDF publications into a flip-book with our unique Google optimized e-Paper software.
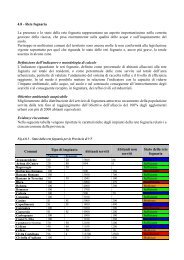
Tab.�6.9.�Superficie�agricola�utilizzata�per�classi�<strong>di</strong>�SAU�(ha)����anno�2000�<br />
Lynx Natura e Ambiente s.r.l.<br />
COMUNE� 100� TOT�<br />
Castel�S.Elia� 78� 41� 60� 46� 162� 156� 264� 224� 1.031�<br />
Nepi� 66� 89� 205� 377� 454� 779� 1.336� 1.355� 4.661�<br />
Totale�<strong>Provincia</strong>� 7.267� 9.931� 24.539� 22.977� 28.193� 40.518� 28.633� 47.908�<br />
209.96<br />
6�<br />
�� %�<br />
Castel�S.Elia� 7,6� 4,0� 5,8� 4,5� 15,7� 15,1� 25,6� 21,7� 100,0�<br />
Nepi� 1,4� 1,9� 4,4� 8,1� 9,7� 16,7� 28,7� 29,1� 100,0�<br />
Totale�<strong>Provincia</strong>� 3,5� 4,7� 11,7� 10,9� 13,4� 19,3� 13,6� 22,8� 100,0�<br />
Fonte:�ISTAT;�nostre�elaborazioni�<br />
�<br />
Per�concludere�questa�<strong>di</strong>samina�sul�settore�agricolo,�non�resta�che�considerare�l’attività�<br />
<strong>di</strong>�allevamento.��<br />
�<br />
Tab.�6.10.�Aziende�con�allevamenti�(anno�2000)�<br />
COMUNE�<br />
ALLEVAM.�<br />
AVICOLI�<br />
BOVINI� BUFALINI� CAPRINI� EQUINI� OVINI� SUINI�<br />
Castel�S.Elia� 58� 5� 0� 0� 8� 8� 17�<br />
Nepi� 156� 43� 1� 3� 28� 39� 54�<br />
Totale�<strong>Provincia</strong>� 5.747� 954� 4� 213� 888� 1.556� 1.345�<br />
� � � � � � � �<br />
�� %�sul�totale�provinciale�<br />
Castel�S.Elia� 1,0� 0,5� 0,0� 0,0� 0,9� 0,5� 1,3�<br />
Nepi� 2,7� 4,5� 25,0� 1,4� 3,2� 2,5� 4,0�<br />
Fonte:�ISTAT;�nostre�elaborazioni�<br />
�<br />
La� tabella� 6.10� mostra� il� numero� <strong>di</strong>� aziende� che� possiedono� un� allevamento.� Si� tenga�<br />
presente� che� si� può� verificare� il� caso� in� cui� il� totale� del� numero� <strong>di</strong>� aziende� con�<br />
allevamento� per� ogni� Comune� può� essere� superiore� al� numero� <strong>di</strong>� aziende� che�<br />
effettivamente�conducono�un�allevamento�presenti�nel�Comune.�Infatti,�può�capitare�che�<br />
la�medesima�azienda�venga�classificata�in�più�<strong>di</strong>�una�classe�<strong>di</strong>�allevamento,�in�quanto�<br />
alleva�più�<strong>di</strong>�una�tipologia�<strong>di</strong>�animale.�Questo�è�il�motivo�per�cui�la�percentuale�è�stata�<br />
calcolata� sul� totale� provinciale,� anziché,� come� in� precedenza,� su� quello� comunale.� Ciò�<br />
premesso,� si� può� notare� che� nel� Comune� <strong>di</strong>� Castel� S.Elia� gli� allevamenti� <strong>di</strong>� una� certa�<br />
<strong>di</strong>ffusione�sono�quello�suinicolo,�1,3%�del�totale�delle�aziende�che�allevano�maiali�nella�<br />
provincia,� quello� avicolo,� 1%,� e,� infine,� quello� equino,� 0,9%.� Per� il� Comune� <strong>di</strong>� Nepi,�<br />
Piano <strong>di</strong> Gestione pSIC/ZPS Fosso Cerreto – Parte I 79