Annual Report - PT SMART Tbk
Annual Report - PT SMART Tbk
Annual Report - PT SMART Tbk
- No tags were found...

You also want an ePaper? Increase the reach of your titles
YUMPU automatically turns print PDFs into web optimized ePapers that Google loves.
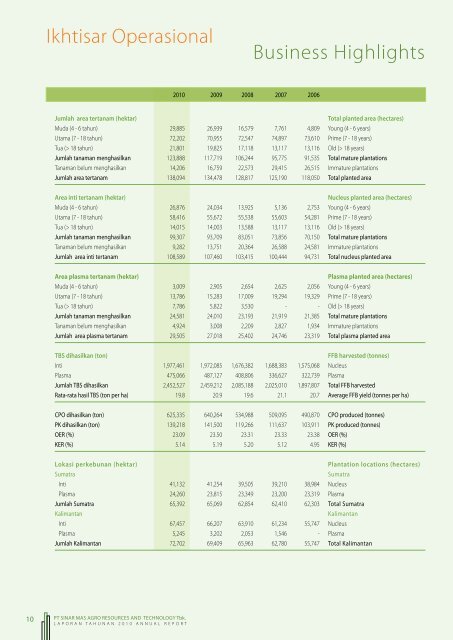
Ikhtisar OperasionalBusiness Highlights2010 2009 2008 2007 2006Jumlah area tertanam (hektar)total planted area (hectares)Muda (4 - 6 tahun) 29,885 26,939 16,579 7,761 4,809 Young (4 - 6 years)Utama (7 - 18 tahun) 72,202 70,955 72,547 74,897 73,610 Prime (7 - 18 years)Tua (> 18 tahun) 21,801 19,825 17,118 13,117 13,116 Old (> 18 years)Jumlah tanaman menghasilkan 123,888 117,719 106,244 95,775 91,535 Total mature plantationsTanaman belum menghasilkan 14,206 16,759 22,573 29,415 26,515 Immature plantationsJumlah area tertanam 138,094 134,478 128,817 125,190 118,050 Total planted areaArea inti tertanam (hektar)nucleus planted area (hectares)Muda (4 - 6 tahun) 26,876 24,034 13,925 5,136 2,753 Young (4 - 6 years)Utama (7 - 18 tahun) 58,416 55,672 55,538 55,603 54,281 Prime (7 - 18 years)Tua (> 18 tahun) 14,015 14,003 13,588 13,117 13,116 Old (> 18 years)Jumlah tanaman menghasilkan 99,307 93,709 83,051 73,856 70,150 Total mature plantationsTanaman belum menghasilkan 9,282 13,751 20,364 26,588 24,581 Immature plantationsJumlah area inti tertanam 108,589 107,460 103,415 100,444 94,731 Total nucleus planted areaArea plasma tertanam (hektar)Plasma planted area (hectares)Muda (4 - 6 tahun) 3,009 2,905 2,654 2,625 2,056 Young (4 - 6 years)Utama (7 - 18 tahun) 13,786 15,283 17,009 19,294 19,329 Prime (7 - 18 years)Tua (> 18 tahun) 7,786 5,822 3,530 - - Old (> 18 years)Jumlah tanaman menghasilkan 24,581 24,010 23,193 21,919 21,385 Total mature plantationsTanaman belum menghasilkan 4,924 3,008 2,209 2,827 1,934 Immature plantationsJumlah area plasma tertanam 29,505 27,018 25,402 24,746 23,319 Total plasma planted areaTBS dihasilkan (ton)FFB harvested (tonnes)Inti 1,977,461 1,972,085 1,676,382 1,688,383 1,575,068 NucleusPlasma 475,066 487,127 408,806 336,627 322,739 PlasmaJumlah TBS dihasilkan 2,452,527 2,459,212 2,085,188 2,025,010 1,897,807 Total FFB harvestedRata-rata hasil TBS (ton per ha) 19.8 20.9 19.6 21.1 20.7 Average FFB yield (tonnes per ha)CPO dihasilkan (ton) 625,335 640,264 534,988 509,095 490,870 CPO produced (tonnes)PK dihasilkan (ton) 139,218 141,500 119,266 111,637 103,911 PK produced (tonnes)OER (%) 23.09 23.50 23.31 23.33 23.38 OER (%)KER (%) 5.14 5.19 5.20 5.12 4.95 KER (%)Lokasi perkebunan (hektar)plantation locations (hectares)SumatraSumatraInti 41,132 41,254 39,505 39,210 38,984 NucleusPlasma 24,260 23,815 23,349 23,200 23,319 PlasmaJumlah Sumatra 65,392 65,069 62,854 62,410 62,303 Total SumatraKalimantanKalimantanInti 67,457 66,207 63,910 61,234 55,747 NucleusPlasma 5,245 3,202 2,053 1,546 - PlasmaJumlah Kalimantan 72,702 69,409 65,963 62,780 55,747 Total Kalimantan10 <strong>PT</strong> Sinar Mas Agro Resources and Technology <strong>Tbk</strong>.Laporan Tahunan 2010 AnNual <strong>Report</strong>