Total Number of Slum.pdf
Total Number of Slum.pdf
Total Number of Slum.pdf

Create successful ePaper yourself
Turn your PDF publications into a flip-book with our unique Google optimized e-Paper software.
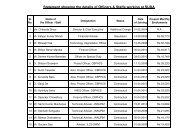
<strong>Total</strong> number <strong>of</strong> slum Pockets, <strong>Slum</strong> populationpercentage <strong>of</strong> <strong>Slum</strong> population, total number <strong>of</strong> CDS, NHC andNHG formed in the urban local bodiesSI. NO. Name <strong>of</strong> the Urban Local <strong>Total</strong> No. <strong>Total</strong> Percentage <strong>Total</strong> No <strong>Total</strong> No. <strong>Total</strong> No.Bodies<strong>of</strong> <strong>Slum</strong> <strong>Slum</strong> <strong>of</strong> <strong>Slum</strong> <strong>of</strong> CDS <strong>of</strong> NHC <strong>of</strong> NHG1. Kolkata M.C. 5600 1490811 32.55 1 70 3202. Howrah M.C. — 118236 11.72 5 31 3723. Bally 229 70073 26.79 3 27 2294. Uluberia 27 119468 59.11 4 28 2785. Bansberia 60 18232 17.45 2 22 2336. Hooghly-Chinsurah 91 17921 10.53 6 65 3327. Chandannagar M.C. 41 42894 26.45 3 33 2888. Bhadreswar 6 56588 53.41 2 20 2239. Chamdani 129 75583 73.22 2 22 23910. Baidyabati 40 — 0 2 26 21511. Serampur 341 61219 30.93 2 25 34112. Rishra 11 53755 47.26 2 23 18413. Konnagar 11 11026 15.27 2 19 9814. Uttarpara-Kotrung 28 40000 26.63 2 23 27815. Kanchrapara 388 14223 11.28 2 24 28916. Halisahar 32 18733 16.05 2 38 42117. Naihati 23 19923 9 25 — 29 41318. Bhatpara 34 107581 24.34 6 35 51719. Garulia 46 26793 33.56 2 21 16320. North Barrackpore 15 13774 11.15 2 22 24121. Barrackpore 37 4459 3.09 2 24 25322. Titagarh 23 98062 78.96 2 25 25323. Khardah 40 24303 20.91 2 24 28724. Panihati 62 93554 26.85 4 43 46225. Kamarhati 8 3607 1.16 4 40 50726. Baranagar 13 55987 22.34 3 33 43327. Barasat 20 39000 16.85 3 40 39628. Madhyamgram 40 4959 3.2 2 46 52129. New Barrackpore 26 16809 19.01 1 22 18230. North Dum Dum 25 2662 1.21 2 27 38031. Dum Dum 20 19638 18.38 2 16 14032. South Dum Dum 64 97579 24.88 2 23 19533. Bidhannagar — 49173 29.3 1 20 20034. Rajarliat-Gopalpur 13 24817 9.13 4 18 19935. Budge Budge 22 26486 34.15 2 23 22136. Rajpur-Sonarpur 72 — 0 5 33 44037. Maheshtala 30 48403 12.44 4 49 68738. Baruipur 5 4560 10.14 2 17 10239. Pujali 20 6823 20.15 1 I5 10340. Kalyani 16 39429 48.09 2 22 24341. Gayespur 18 14283 25.96 2 20 18042. Cooch Bihar 52 — 0 2 20 16143. Dinhata 54 18074 52.69 1 16 22544. Tufanganj 50 6868 35.6 1 12 5445. Mathabhanga 12 — 0 1 12 6846. Makliganj 27 — 0 1 10 10047. HaJdibari 11 8000 60.74 1 11 10048. Jalpaiguri 30 34705 4.77 2 25 249Page 1
<strong>Total</strong> number <strong>of</strong> slum Pockets, <strong>Slum</strong> populationpercentage <strong>of</strong> <strong>Slum</strong> population, total number <strong>of</strong> CDS, NHC andNHG formed in the urban local bodiesSI. NO. Name <strong>of</strong> the Urban Local <strong>Total</strong> No. <strong>Total</strong> Percentage <strong>Total</strong> No <strong>Total</strong> No. <strong>Total</strong> No.Bodies<strong>of</strong> <strong>Slum</strong> <strong>Slum</strong> <strong>of</strong> <strong>Slum</strong> <strong>of</strong> CDS <strong>of</strong> NHC <strong>of</strong> NHG49. Alipurduar — — 0 2 31 29450. Mal 25 18133 78.12 1 15 8151. Darjeeling 26 8296 7.72 3 32 20752. Kursaong 27 — 0 2 20 15053. Kalimpong 47 — 0 3 30 30654. Mirik N.A.A. — — 0 1 9 4555. Siliguri M.C 151 173111 36:81 15 151 99856. Raiganj 89 68019 41.17 5 52 60657. Islampur 39 — 0 2 24 27458. Kaliaganj — — 0 2 22 20959. Balurghat 90 40484 29.87 5 42 41060. Gangarampur 39 35000 65.36 2 26 26861. Enqlish Bazar 53 58124 35 3 29 43262. Old Malda 18 — 0 2 20 24363. Suri 144 21871 35.38 2 18 14464. Rampurhat 37 27730 54.8 1 17 14965. Bolpur — — 0 2 18 14166. Dubrajpur 56 17367 53.03 2 16 18267. Sainthia 27 16385 41.76 1 16 14768. Krishnagar 17 19767 14.21 4 43 53369. Nabadwip 103 49321 42.87 2 37 56470. Shantipur 44 34065 24.65 2 35 69971. Ranaghat 30 4963 7.22 2 19 22772. Birnagar 72 19014 71.49 1 14 7273. Chakdaha 52 31070 35.73 2 31 40574. Taherpur N A A 92 14015 69.86 1 13 9275. Coopers' Camp N.N.A — — 0 1 12 6576. Bongaon 104 60000 58.76 3 21 56477. Gobardanga 59 20000 48.06 1 17 19278. Baduria 177 14960 31.55 1 17 17779. Basirhat 388 34000 30.06 2 22 38980. Taki 67 20025 53.58 1 18 14081. Ashoknagar-Kalyangarh 28 — 0 2 28 29382. Habra 88 19923 0 3 42 42183. Joynagar-Mazilpur 10 13830 59.31 1 14 9384. Diamond Harbour 45 — 0 1 16 10885. Medinipur 86 41533 27.08 4 24 40086. Tamluk 115 25603 55.87 2 19 12887. Ghatal 54 17821 34.55 2 17 13988. Chandrakona 17 — 0 1 12 9089. Ramjibanpur 18 3105 17.88 1 11 5990. Khirpai 21 — 0 1 10 5191. Kharar 10 — 0 1 10 3292. Kharagpur 282 41873 20.13 4 39 52193. Egra 62 — 0 1 14 13694. Contai 174 16461 21.24 2 18 17995. Jhargram 109 25000 47.03 2 16 13396. Haldia 131 24594 14.41 5 25 500Page 2
<strong>Total</strong> number <strong>of</strong> slum Pockets, <strong>Slum</strong> populationpercentage <strong>of</strong> <strong>Slum</strong> population, total number <strong>of</strong> CDS, NHC andNHG formed in the urban local bodiesSI. NO. Name <strong>of</strong> the Urban Local <strong>Total</strong> No. <strong>Total</strong> Percentage <strong>Total</strong> No <strong>Total</strong> No. <strong>Total</strong> No.Bodies<strong>of</strong> <strong>Slum</strong> <strong>Slum</strong> <strong>of</strong> <strong>Slum</strong> <strong>of</strong> CDS <strong>of</strong> NHC <strong>of</strong> NHG97. Bankura 295 63324 49.16 4 35 38198. Bishnupur — — 0 — —99. Sonamukhi 15 — 0 1 15 121100. Puruliya 114 — 0 0 22 204101. Jhalda — — 0 1 12 50102. Raghunathpur 44 — 0 1 16 90103. Bardwan 34 59719 20.89 3 42 504104. Kalna 81 36051 69.1 1 19 165105. Katwa 44 24869 34.75 2 19 165106. Daihat 90 — 0 1 14 108107. Raniganj 45 45200 36.78 6 35 283108. Asansol M.C 188 158945 32.68 8 148 1900109. Guskara 113 20241 63.53 1 16 174110. Durgapur M.C 91 149429 30.31 5 57 714111. Kulti 70 40702 14.03 2 26 234112. Memari 42 — 0 1 16 120113. Jamuria 146 — 0 2 36 307114. Arambagh 140 26800 47.75 2 18 140115. Tarakeswar 38 16245 57.65 1 15 130116. Baharampur 50 31455 19.64 5 52 484117. Murshidabad 276 — 0 2 31 276118. Jiaganj-Azimganj — — 0 1 17 7119. Kandi 106 — 0 3 19 149120. Jangipur 78 15711 21.1 1 20 225121. Dhulian 60 — 0 2 19 19122. Beldanga 40 12000 47.32 1 16 155123. Nalhati — — 0 — — —124. Dhupguri — — 0 — — —125. Panskura — — 0 — — —Note: <strong>Total</strong> <strong>Slum</strong> population Data:(i) Supplied by ULBs.(ii) Rest data supplied from census (2001)Page 3