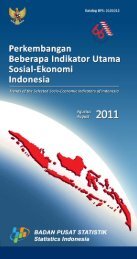
Trends of Selected Socio-Economic Indicators of Indonesia, August ...
Trends of Selected Socio-Economic Indicators of Indonesia, August ...
Trends of Selected Socio-Economic Indicators of Indonesia, August ...
You also want an ePaper? Increase the reach of your titles
YUMPU automatically turns print PDFs into web optimized ePapers that Google loves.
Tabel<br />
Table 5.4<br />
Produksi Jagung Menurut Provinsi (ton), 2009-2012<br />
Production <strong>of</strong> Maize by Province (tons), 2009-2012<br />
Provinsi/Province 2009 2010 2011 2012 1)<br />
Aceh 137 753 167 090 168 861 148 525<br />
Sumatera Utara 1 166 548 1 377 718 1 294 645 1 349 874<br />
Sumatera Barat 404 795 354 262 471 849 473 712<br />
Riau 56 521 41 862 33 197 31 998<br />
Kepulauan Riau 1 064 961 923 909<br />
Jambi 38 169 30 691 25 521 37 470<br />
Sumatera Selatan 113 167 125 796 125 688 121 666<br />
Kepulauan Bangka Belitung 1 403 1 055 850 1 393<br />
Bengkulu 93 798 74 331 87 362 133 134<br />
Lampung 2 067 710 2 126 571 1 817 906 1 825 292<br />
DKI Jakarta 32 31 23 11<br />
Jawa Barat 787 599 923 962 945 104 959 879<br />
Banten 27 083 28 557 13 863 12 320<br />
Jawa Tengah 3 057 845 3 058 710 2 772 575 2 981 460<br />
DI Yogyakarta 314 937 345 576 291 596 356 989<br />
Jawa Timur 5 266 720 5 587 318 5 443 705 5 952 268<br />
Bali 92 998 66 355 64 606 67 209<br />
Nusa Tenggara Barat 308 863 249 005 456 915 634 297<br />
Nusa Tenggara Timur 638 899 653 620 524 638 625 544<br />
Kalimantan Barat 166 833 168 273 160 819 169 775<br />
Kalimantan Tengah 8 048 9 345 9 208 9 345<br />
Kalimantan Selatan 113 885 116 449 99 779 109 719<br />
Kalimantan Timur 12 520 11 993 7 341 7 814<br />
Sulawesi Utara 450 989 446 144 438 504 447 425<br />
Gorontalo 569 110 679 167 605 782 661 788<br />
Sulawesi Tengah 164 282 162 306 161 810 142 337<br />
Sulawesi Selatan 1 395 742 1 343 044 1 420 154 1 458 412<br />
Sulawesi Barat 58 320 58 020 82 995 92 583<br />
Sulawesi Tenggara 71 655 74 840 67 997 80 889<br />
Maluku 15 859 15 273 13 875 15 551<br />
Maluku Utara 18 229 20 546 26 149 26 756<br />
Papua 6 787 6 834 6 885 6 812<br />
Papua Barat 1 585 1 931 2 125 1 968<br />
<strong>Indonesia</strong> 17 629 748 18 327 636 17 643 250 18 945 124<br />
Sumber: Produksi Tanaman Pangan, BPS<br />
Source: Production <strong>of</strong> Food Crops, BPS-Statistics <strong>Indonesia</strong><br />
Catatan: Bentuk produksi jagung adalah pipilan kering<br />
1)<br />
Angka ramalan I<br />
Note:<br />
Maize production form is dried loose<br />
1)<br />
First forecast<br />
68<br />
<strong>Trends</strong> <strong>of</strong> <strong>Selected</strong> <strong>Socio</strong>-<strong>Economic</strong> <strong>Indicators</strong> <strong>of</strong> <strong>Indonesia</strong>, <strong>August</strong> 2012


