

Trends of Selected Socio-Economic Indicators of Indonesia, August ...
Trends of Selected Socio-Economic Indicators of Indonesia, August ...
Trends of Selected Socio-Economic Indicators of Indonesia, August ...

Create successful ePaper yourself
Turn your PDF publications into a flip-book with our unique Google optimized e-Paper software.
Tabel<br />
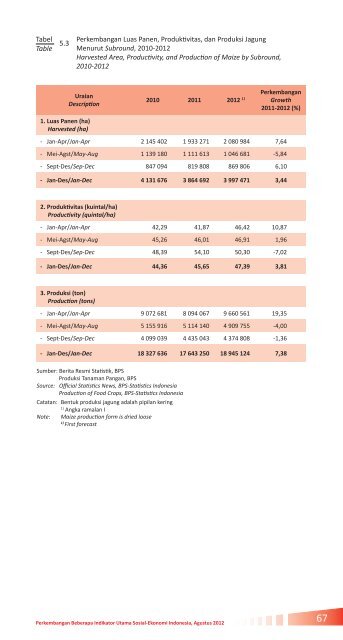
Perkembangan Luas Panen, Produktivitas, dan Produksi Jagung<br />
Menurut Subround, 2010-2012<br />
Harvested Area, Productivity, and Production <strong>of</strong> Maize by Subround,<br />
2010-2012<br />
Table 5.3 Uraian<br />
Description<br />
1. Luas Panen (ha)<br />
Harvested (ha)<br />
2010 2011 2012 1) Growth<br />
Perkembangan<br />
2011-2012 (%)<br />
- Jan-Apr/Jan-Apr 2 145 402 1 933 271 2 080 984 7,64<br />
- Mei-Agst/May-Aug 1 139 180 1 111 613 1 046 681 -5,84<br />
- Sept-Des/Sep-Dec 847 094 819 808 869 806 6,10<br />
- Jan-Des/Jan-Dec 4 131 676 3 864 692 3 997 471 3,44<br />
2. Produktivitas (kuintal/ha)<br />
Productivity (quintal/ha)<br />
- Jan-Apr/Jan-Apr 42,29 41,87 46,42 10,87<br />
- Mei-Agst/May-Aug 45,26 46,01 46,91 1,96<br />
- Sept-Des/Sep-Dec 48,39 54,10 50,30 -7,02<br />
- Jan-Des/Jan-Dec 44,36 45,65 47,39 3,81<br />
3. Produksi (ton)<br />
Production (tons)<br />
- Jan-Apr/Jan-Apr 9 072 681 8 094 067 9 660 561 19,35<br />
- Mei-Agst/May-Aug 5 155 916 5 114 140 4 909 755 -4,00<br />
- Sept-Des/Sep-Dec 4 099 039 4 435 043 4 374 808 -1,36<br />
- Jan-Des/Jan-Dec 18 327 636 17 643 250 18 945 124 7,38<br />
Sumber: Berita Resmi Statistik, BPS<br />
Produksi Tanaman Pangan, BPS<br />
Source: Official Statistics News, BPS-Statistics <strong>Indonesia</strong><br />
Production <strong>of</strong> Food Crops, BPS-Statistics <strong>Indonesia</strong><br />
Catatan: Bentuk produksi jagung adalah pipilan kering<br />
1)<br />
Angka ramalan I<br />
Note: Maize production form is dried loose<br />
1)<br />
First forecast<br />
Perkembangan Beberapa Indikator Utama Sosial-Ekonomi <strong>Indonesia</strong>, Agustus 2012<br />
67


